



 Multiple industries nationwide (thermal power generation / iron and steel metall
 Engineering-scale (a single circulating water system handles thousands to tens o
Circulating Cooling Water Concentration: Pushing Cycles of Concentration Up to 5 Times, While the Same Standard Applies the Brakes at 1100 mg/L Points
Concentration of industrial circulating water is widely recognized as the cheapest means of water conservation. But the term "cycles of concentration" is never a single number in actual operation—it simultaneously depends on which ion you use to measure it, whether windage losses are counted in the denominator, and who you intend to foot the bill.
I. First, positioning: what exactly is being concentrated in a circulating water system
A cooling tower dissipates heat through evaporation: water turns into steam and carries away latent heat of vaporization, and the steam contains no salt. The remaining dissolved solids, chloride ions, sulfate, calcium and magnesium, alkalinity, and silica are all retained in the circulating water, with concentrations continuously accumulating along with makeup water. This accumulation ratio is the cycles of concentration N, defined by two equivalent expressions: the ratio method N = ccirculating / cmakeup (the ratio of the concentration of a conservative component in circulating water to that in makeup water), and the water quantity method N = Qm / (Qb + Qw) (makeup water quantity divided by the sum of blowdown water quantity and windage loss).
The two expressions are two sides of the same thing, but their respective "edges" are different: the edge of the ratio method lies in "which component is measured", while the edge of the water quantity method lies in "whether the denominator includes windage loss". These two points are precisely the first and second sources of definitional ambiguity throughout this article.
Raising N simultaneously amplifies four things, and their directions are all different:
| Objects Amplified by N | Amplification Mode | Trigger Conditions | Engineering Consequences |
|---|---|---|---|
| Calcium Carbonate Scaling | Calcium hardness and alkalinity both multiplied by N | Calcium hardness + total alkalinity > 1100 mg/L (as CaCO₃) | Heat exchanger tube thermal resistance rises, terminal temperature difference increases |
| Metal Corrosion | Cl⁻ and SO₄²⁻ both multiplied by N, dissolved oxygen continuously saturated by aeration in the tower | Elevated wall temperature, low flow velocity, occluded zones under deposits | Pitting, under-deposit corrosion, perforation |
| Microbial Proliferation | Nutrients multiplied by N, with light, oxygen and 30~40℃ present in the tower | Insufficient residual chlorine, ammonia nitrogen preferentially consumes free chlorine | Biological slime clogs fill media and piping |
| Chemical Loss | Leaves the system with blowdown and windage losses | The greater the blowdown volume, the faster the loss | Chemical cost varies with N |
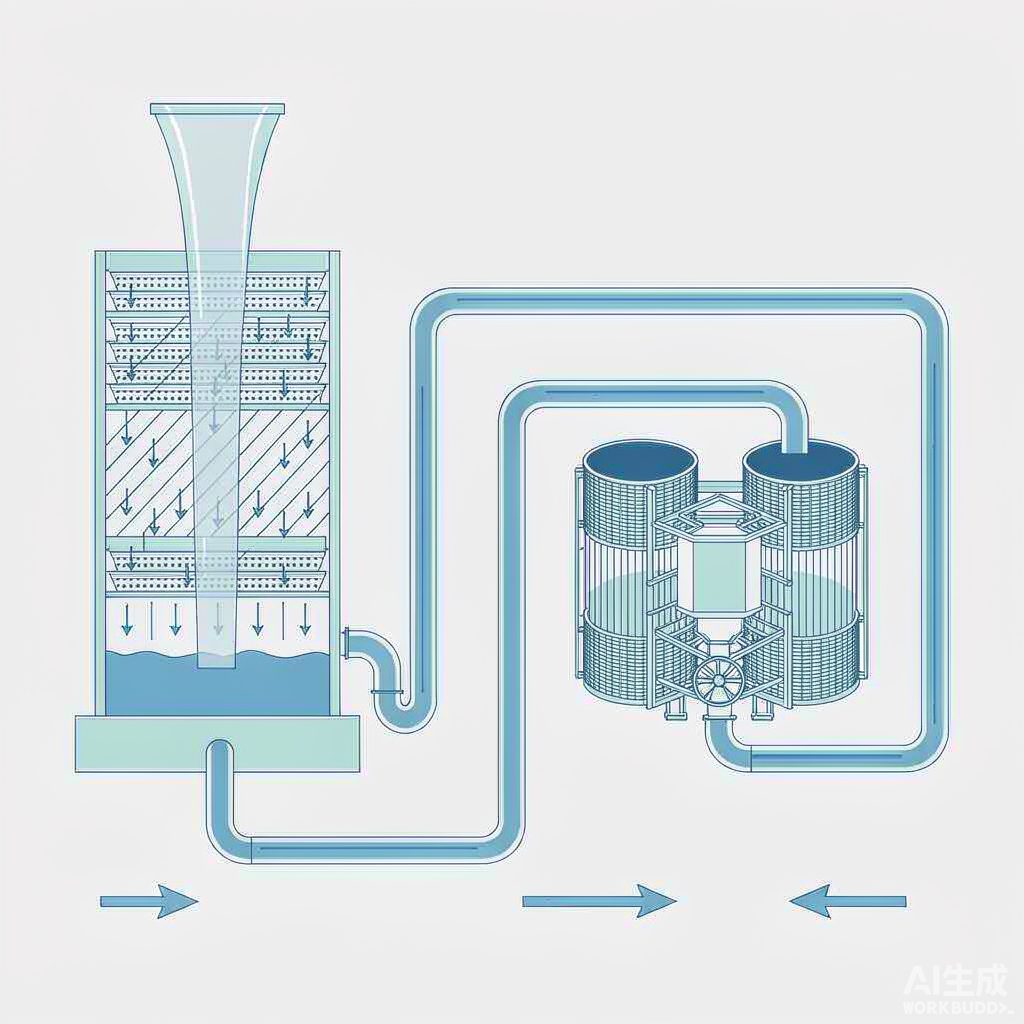
The most easily overlooked point in this figure is this: windage loss and blowdown are the same type of outlet, while evaporation is another. All three let water leave the system, but only the first two let salts and chemicals leave. Keep this in mind, and the dispute over the denominator in Section 3 becomes a simple arithmetic problem.
II. Caliber One: What Ion Is Used to Measure the Numerator—Four Different N Values Can Be Calculated from the Same System
GB/T 50050—2017 "Code for Design of Industrial Circulating Cooling Water Treatment" Article 3.1.11 provides the formula for the water quantity method, but does not specify which ion should be used to calculate the ratio method. In actual engineering practice, there are four approaches, and they give different answers for the same pool of water, with the direction of deviation being consistent.
| Tracer Component | Direction of Deviation from True Value | Source of Deviation | Applicable Preconditions |
|---|---|---|---|
| Potassium ion K⁺ | Closest to true value | Does not precipitate, does not volatilize, is not affected by oxidizing biocides, and its content in natural water is stable | Accurate accounting, high testing cost |
| Chloride ion Cl⁻ | Systematically high | Chlorine-based biocides (sodium hypochlorite, liquid chlorine) themselves introduce Cl⁻ into the water, and Cl⁻ does not precipitate or volatilize | The system does not dose chlorine-based biocides, or the amount introduced by chemicals has been deducted |
| Electrical conductivity EC | High | CO₂ escapes in the tower, raising pH and converting HCO₃⁻ to CO₃²⁻, which changes the conductive behavior; online meters are prone to drift | Stable composition, regular calibration |
| Silica SiO₂ | Moderately high | Affected by silicon-containing chemicals and pH | Used for verification under specific water quality conditions |
| Calcium hardness Ca²⁺ | Systematically low | Calcium carbonate precipitation causes calcium to disappear from the water, so what is measured is only "the portion that did not settle out" | Reverse check of scaling tendency |
These five rows may look like simply "choosing a ruler," but three publicly available sources give three conflicting answers to "which ruler is the first choice":
The first source (a technical article from a circulating water technical service provider, "Conversion of Circulating Water System Parameters") states that chloride ions are "the first choice in practice, not prone to reaction or volatilization, with mature and reliable detection, and are the daily monitoring baseline for most systems", that conductivity "is prone to being elevated due to the influence of CO₂ escape, etc., and should be used with caution", and that potassium ions are the "gold standard". The second source (the Science Popularization China entry "Concentration Ratio", reviewed by scholars from North China Electric Power University) states: "Because chloride ions have artificial addition factors, using chloride ions to express the concentration ratio has little practical significance", that calcium ions are "on the low side", and that potassium ions are "relatively accurate". The third source (calculation notes from a cooling tower equipment supplier) positions the potassium ion method as "suitable for systems with large variations in chloride ion concentration".
None of the three is wrong. Their difference lies only in the default premise: those who say chloride ions are a good baseline assume the system does not dose chlorine-based biocides; those who say chloride ions are meaningless assume the system is dosing them. Yet the mainstream practice in industrial circulating water systems is precisely to rely mainly on oxidizing biocides (GB/T 50050—2017, Article 3.5.1 explicitly states "oxidizing biocides should be the mainstay, with non-oxidizing biocides as supplementary"), that is, by default sodium hypochlorite or liquid chlorine is being used. Under this premise, the concentration ratio calculated by chloride ions will be inflated by the biocide itself—the water quality report shows N has already reached 5.0, but after deducting the portion of chloride introduced by the chemicals, the true value may only be just over 4.
Therefore, "using chloride ions to calculate the concentration ratio" in a chlorinated system must be paired with an action: simultaneously perform a cross-check using potassium ions or conductivity, or back-calculate its contribution to Cl⁻ based on the biocide dosage.
Even more worthy of vigilance is what "using the low-reading ruler" looks like in actual engineering. A paper published in Industrial Water Treatment on a phosphorus-free scheme for a refinery circulating water plant directly writes in the figure caption, "system concentration ratio calculated by calcium hardness", and explains that because the plant is a refinery circulating water system and is affected by emergency discharge and replacement treatment after leakage of heat exchanger process media in the area, "its system concentration ratio is lower than the normal control range". Measuring by calcium hardness measures "the portion of calcium that has not settled out"—the ratio is naturally low. When operators see a low number, their instinct is "we can still increase the concentration", while the chloride ions in the basin may already have exceeded the design value.
To put it into one executable sentence: when reporting the concentration ratio, the qualifier must be included—"concentration ratio calculated by X". An N without a qualifier is not data, it is a slogan.
III. Caliber 2: Whether the denominator includes wind drift loss—the two formulas differ by 1.53 times, and the error is even greater in the high-ratio range
The formula in GB/T 50050—2017, Article 3.1.11 places wind drift loss and blowdown water together in the denominator, written as N = Qm / (Qb + Qw), where Qm is makeup water volume, Qb is blowdown water volume, and Qw is wind drift loss water volume. The most common expression in operating reports is N ≈ Qm / Qb, which omits wind drift loss.
How large is this difference? Calculate it using a real system from an industry review. The review gives: for a system with circulating water volume 10 000 m³/h, when the concentration ratio increases from 3.0 to 5.0, makeup water volume decreases from 166 m³/h to 138 m³/h, blowdown water volume decreases from 56 m³/h to 28 m³/h, and based on this, water savings of 28 m³/h (water-saving rate 16.9%) and emission reduction of 28 m³/h (emission reduction rate 50%) are calculated.
Now add wind drift loss into the denominator according to the standard formula. Cooling tower wind drift loss is usually taken as 0.2%~0.5% of circulating water volume; taking the median 0.3%, that is 30 m³/h:
| Basis | Formula | Substitution (Qm=166, Qb=56, Qw=30) | Result |
|---|---|---|---|
| Standard 3.1.11 (including windage loss) | N = Qm /(Qb + Qw) | 166 ÷(56 + 30) | 1.93 |
| Most operating reports (ignoring windage loss) | N ≈ Qm / Qb | 166 ÷ 56 | 2.96 |
| Difference | — | 2.96 ÷ 1.93 | 1.53 times |
The 1.53 times is not a fixed deviation; it amplifies as the number of cycles increases: the higher the number of cycles, the smaller the blowdown Qb, while the windage loss Qw remains essentially unchanged, so the ratio Qw/Qb becomes larger. In other words, the gap between the "number of cycles on the report" and the "number of cycles calculated per the standard" is actually widest in the high-cycle range that everyone most wants to promote.
Incidentally, here is a usable reverse verification. An engineering paper on acid dosing for thermal circulating water at the Xuansteel Power Plant provides: the concentration ratio increased from 1.9 times to 3.3 times, the makeup water (industrial water) consumption decreased from 1 545.3 t/h to 1 050.3 t/h, and the blowdown volume decreased from 752.3 t/h to 257.3 t/h. Back-calculating according to the standard formula: 1 050.3 ÷ 3.3 = 318.3, minus the blowdown volume of 257.3, gives a windage loss of approximately 61 t/h; substituting back to before the retrofit, 1 545.3 ÷ (752.3 + 61.0) = 1.90—exactly equal to the 1.9 times reported in the paper.The two sets of figures are fully self-consistent, indicating that this paper uses a basis that includes windage loss.Only reports that can be cross-verified in this way are comparable.
IV. Basis Three: Two Opposite Clauses in the Same Standard
This is the most engineering-valuable point in the entire article. In GB/T 50050—2017, two adjacent clauses point in opposite directions.
| Clause | Key Points of the Original Text | Direction |
|---|---|---|
| Article 3.1.11 | The design cycles of concentration for an indirect cooling open system should not be less than 5.0, and shall not be less than 3.0; for a direct cooling open system, it shall not be less than 3.0 | Push upward |
| Article 3.1.10 | For an indirect cooling open system and a direct cooling system, when the sum of calcium hardness and total alkalinity is greater than 1100 mg/L (calculated as CaCO₃), or when the stability index RSI is less than 3.3, sulfuric acid shall be added or softening treatment shall be carried out | Press downward |
The conflict between the two clauses is inevitable: as the cycles of concentration increase, calcium hardness and total alkalinity are amplified in the same proportion. The two cannot be satisfied simultaneously unless a treatment step is added in between. A study on circulating water chemical screening at a nitrogen fertilizer enterprise (Kaiyang Chemical) calculated this intersection point very clearly: when the cycles of concentration is 6, the sum of calcium ions and natural total alkalinity reaches 1 145 mg/L, exceeding the upper limit of 1 100 mg/L; at the same time, the RSI is 3.27, which is also below the limit of 3.3—both clauses are triggered simultaneously. The conclusion given by the study is very direct:
"If pH natural equilibrium is adopted without acid addition for pH adjustment, the cycles of concentration of circulating water can only reach 4; if acid is added to adjust the pH to 8.0~8.5, the total alkalinity in the circulating water can be controlled at 100~200 mg/L, enabling the cycles of concentration of circulating water to be ≥ 4."
In other words, the target of "should not be less than 5.0" in Article 3.1.11 of the code is unattainable without treatment for make-up water with high hardness and high alkalinity. It is not a design recommendation, but a check that must be cashed by other means.
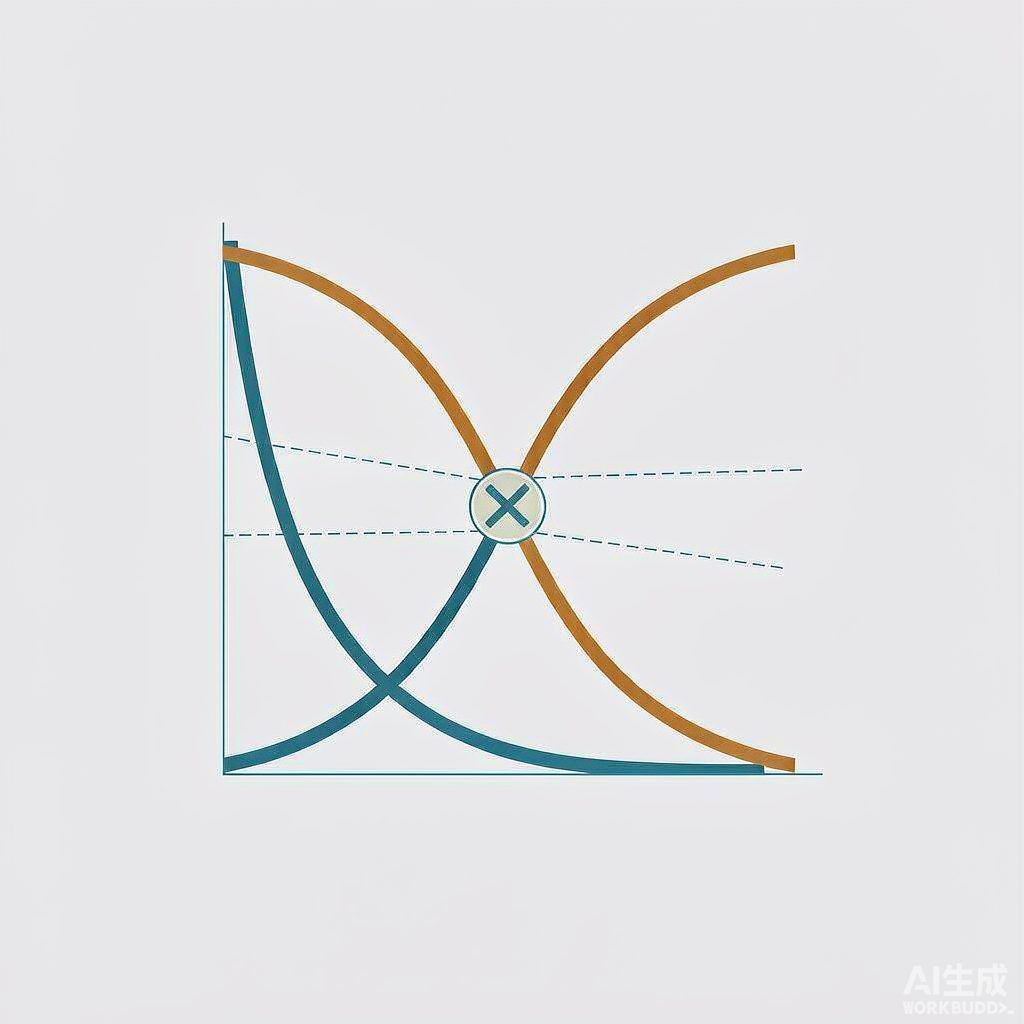
Five technical routes for concentration, each with different costs
| Route | Principle | Achievable Cycles | Main Cost | Applicable Conditions |
|---|---|---|---|---|
| Natural high-alkalinity operation at native pH | No acid dosing, relying solely on corrosion and scale inhibitors | Constrained by both 1100 mg/L and RSI 3.3; high-hardness high-alkalinity water can often only reach 4 cycles | Low ceiling on cycles, large blowdown volume | Low-hardness low-alkalinity makeup water |
| Sulfuric acid dosing | Neutralizes HCO₃⁻ into CO₂ (stripped out of the tower) and SO₄²⁻ (retained in water) | Total alkalinity can be suppressed to 100~200 mg/L, significantly increasing cycles | Acid consumption; SO₄²⁻ accumulation causes calcium sulfate scaling and concrete attack; acid overdose directly causes corrosion | Makeup water with low sulfate; automatic acid dosing with pH interlock |
| Makeup water softening | Lime softening or weak acid cation exchange reduces calcium and alkalinity | Can be stabilized at 5 cycles or above | Investment in softening equipment and regeneration waste liquid; weak acid bed regeneration frequency varies with cycles | High-hardness high-alkalinity water sources such as the "Three-North" region |
| Supersaturated operation with scale inhibitors | Organophosphonates (HEDP, PBTC) and polycarboxylates interfere with crystal growth and cause lattice distortion | Can operate above saturation concentration | Alters crystallization kinetics rather than thermodynamics; allowing supersaturation does not mean there is no upper limit; the chemicals themselves are a blowdown load | Conventional approach for most systems |
| Side-stream filtration + electrochemical | Side-stream filtration removes suspended solids; electrolysis removes scale-forming ions in situ and generates ClO⁻, O₃, etc. for disinfection | Suppliers claim 4~6 cycles; brine reuse projects claim 15~20 cycles [to be verified] | Power consumption and electrode maintenance; supplier self-reported data lacking third-party verification | Systems with existing water treatment facilities that require significant emission reduction |
The acid dosing route deserves the most careful accounting, because it "converts one water balance into another" rather than eliminating the balance. Sulfuric acid neutralizes alkalinity into sulfate, which remains in the water and must still be removed via blowdown; CO₂ does escape, but that is accomplished by the aeration function of the tower. Boundary values Field measurements at Xuangang provide two reference lines: at 3 cycles of concentration, SO₄²⁻ in water is approximately 400 mg/L, and below 500 mg/L it causes no corrosion to cooling tower concrete; when the calcium sulfate index (in mg/L) is less than 2×10⁵, calcium sulfate scaling generally does not occur.
What makes it even more troublesome is choosing which acid to use. When the makeup water has high sulfate content or the cycles of concentration are very high, adding sulfuric acid itself may cause calcium sulfate scaling; switching to hydrochloric acid introduces chloride ions, and chloride ions aggravate pitting corrosion and stress corrosion cracking on stainless steel. This closed loop has no free exit—which also explains why acid dosing must be paired with automatic acid dosing and pH interlocking, rather than manual adjustment a few times a day.
V. Caliber Four: RSI and LSI point in opposite directions, and they only govern calcium carbonate
The formulas of the two indices look very similar, but their directions are exactly opposite:
Langelier Saturation Index LSI = pHactual − pHs: greater than 0 indicates supersaturation and a scaling tendency; less than 0 indicates undersaturation and a corrosion tendency.
Ryznar Stability Index RSI = 2 pHs − pHactual: less than 6 indicates a scaling tendency; greater than 6 indicates a corrosion tendency. The two are simply two ways of assembling the same pHs, so the numbers calculated for the same water using the two indices are reversed—when LSI is positive, RSI is low (scaling); when LSI is negative, RSI is high (corrosion). Mixing up the two on site is one of the most classic sources of misjudgment in circulating water.
There are also two sets of thresholds in parallel use: Clause 3.1.10 of GB/T 50050—2017 uses RSI less than 3.3; whereas engineering materials and classification tables generally use RSI less than 3.7 as "severe scaling", and classify the entire range of 2.7~3.7 as "severe scaling." The two are not the same thing—one comes from a specification clause, the other is an empirical classification.
① RSI is not the Langelier index.RSI is the Ryznar Stability Index, while LSI is the Langelier Saturation Index; the two have different formulas and opposite directions, and cannot be conflated.
② The original specification text is 3.3, not 3.7.The water quality classification table at the beginning of the same article uses 3.7 ("RSI<3.7 severe scaling"), which amounts to writing the engineering empirical threshold and the specification limit into the same sentence.
Citations with this kind of double error of "index name + threshold" appear very frequently in Chinese circulating water materials. Whenever a judgment involves whether acid should be added, be sure to check against the original text of Clause 3.1.10 of GB/T 50050—2017.
Conclusion: using RSI to judge "whether acid should be added" is valid (what it asks about is calcium carbonate); using RSI to judge "whether the corrosion rate will exceed the standard" is not valid. The corrosion rate can only be measured by coupons, test tubes, or online corrosion probes.
VI. Caliber Five: 0.075 mm/a is a criterion for the "water side of the heat transfer surface," not for piping
Clause 3.1.5 of GB/T 50050—2017 provides a set of grouped control indicators for heat exchange equipment in indirect open cooling systems. These figures are widely cited and used individually on site, whereas they were originally meant to be used as a set.
| Indicator | Limit | Unit | Common Pitfall |
|---|---|---|---|
| Corrosion rate on the water side of the heat transfer surface of carbon steel equipment | Should be less than 0.075 | mm/a | Average value, not the upper limit of pitting depth |
| Corrosion rate on the water side of the heat transfer surface of copper alloy and stainless steel equipment | Should be less than 0.005 | mm/a | 15 times stricter than carbon steel, counterintuitive |
| Fouling thermal resistance on the water side of the heat transfer surface | Should not exceed 3.44×10⁻⁴ | m²·K/W | Closed systems require less than 0.86×10⁻⁴, 4 times stricter |
| Adhesion rate on the water side of the heat transfer surface | Should not exceed 15 (refining industry 20) | mg/(cm²·month) | Not the same physical quantity as corrosion rate, not interchangeable |
| Tube-side / shell-side flow velocity | Tube side greater than 1.0 / shell side greater than 0.3 | m/s | Low flow velocity leads to deposition, a precursor to scaling |
| Wall temperature on the cooling water side of the heat transfer surface | Should not be higher than 70 | ℃ | Excessively high wall temperature accelerates both scaling and corrosion |
| Total heterotrophic bacteria count / biological slime volume | Should not exceed 1×10⁵ / should not exceed 3 | CFU/mL / mL/m³ | "Should not exceed" is a control guideline, not a pass line |
| Free chlorine (continuous / shock / allowable value) | 0.1~0.5 / 0.5~1.0 maintained at 2~3 h / 0.1~1.0 | mg/L | Three sets of criteria correspond to three dosing methods; mixing them up leads to long-term overdosing |
There are three misreadings in this table that must be made crystal clear.
First point: 0.005 and 0.075 differ by a factor of 15, and the direction is "stainless steel is stricter." Intuition easily leads to the conclusion that "stainless steel is corrosion-resistant, so the limits should be looser," but the reality is completely the opposite. The reason is that the failure mechanisms of the two materials differ: carbon steel acts through uniform thinning, so an allowance can be given based on the annualized average depth; stainless steel relies on a passive film, and once the film breaks down locally, it becomes pitting or crevice corrosion, with corrosion concentrated over an extremely small area, so the average value converted from uniform weight loss is almost meaningless. Therefore, the limits for stainless steel must instead be an order of magnitude stricter.
Second point: the three criteria are not interchangeable. Corrosion rate is mm/a (average thinning depth per year), adhesion rate is mg/(cm²·month) (foulant increment per unit heat transfer surface per month), and fouling thermal resistance is m²·K/W (the degree of heat transfer efficiency decline caused by deposits). These three are often lumped into the single phrase "corrosion and scaling conditions are good," but in fact they answer three different questions: how much wall thickness remains on the tube, how often cleaning is needed, and how much heat exchange efficiency has dropped. They are also coupled—when the adhesion rate is relatively high, the water chemistry environment beneath the scale layer differs significantly from the bulk water, making it easy to form an occluded zone and trigger under-deposit corrosion, at which point both indicators rise simultaneously.
Third point: field coupons are not on the heat transfer surface. The specification gives the criterion for the "water side of equipment heat transfer surface," while field coupons and test tubes are usually installed on a bypass, where the water temperature is lower than the heat transfer surface wall temperature (the specification also requires that the cooling water side wall temperature of the heat transfer surface should preferably not exceed 70℃), and the flow velocity may also be lower than the tube-side requirement of 1.0 m/s. Therefore, a coupon measurement of 0.05 mm/a being "qualified" does not mean the heat exchange equipment is qualified; conversely, 0.075 mm/a is an average value, and scattered pits are commonly seen on coupon surfaces—the average value converted from weight loss may be only 0.04 mm/a, while the local depth at the bottom of the pits is significantly higher than this value. When examining coupons, one must not look only at the numbers but must also examine the morphology: uniform thinning, localized pitting, or under-deposit corrosion—the treatment directions for these three are completely different.
Grouped criteria, continuous monitoring, and open-cover verification—this is the complete evidence chain for the statement "corrosion and scaling control is good."
Seven, Basis Six: Which basis the chemical dosage is calculated on—what differs is exactly the cycles of concentration itself
This is the point most easily overlooked and most easily written vaguely in commercial materials. For the same matter, descriptions on the market give at least three bases: one-time dosing based on holding water volume (mostly used for pre-filming after new construction or cleaning), continuous dosing based on makeup water volume, and continuous dosing based on blowdown water volume.
First, a steady-state derivation. There are mainly two pathways by which chemicals are consumed in the system: discharge from the system with circulating water (blowdown + windage loss), and degradation, adsorption, or reaction with calcium and magnesium. Under steady state considering only the first pathway, the dosage required to maintain the target concentration should correspond to Qb + Qw—because what evaporates is pure water, which does not carry away chemicals.
That is to say, doing both "dosing by makeup water volume" and "setting according to the target concentration in the literature" at the same time is theoretically an N-fold overdose. The higher the factor, the greater the overdose—in a system with N=5, dosing by makeup water volume is equivalent to 5 times dosing by blowdown volume.
One commercial technical document states this most bluntly: "Daily dosing: dosing concentration × makeup water volume (blowdown volume)/1000, among which blowdown volume is more accurate, since chemical loss is mainly caused by blowdown, and if makeup water volume is used for calculation, the dosing concentration must be adjusted accordingly." Several other commercial descriptions only give the formula "calculated by makeup water volume" (dosage = target concentration × makeup water volume ÷ 1000), completely omitting this N-fold difference and also omitting whether the target concentration should be adjusted accordingly.
It should be noted here that this is a steady-state idealized conclusion, which does not account for losses such as chemical degradation, adsorption, and reactions with calcium, magnesium, and suspended solids. In engineering practice, on-site chemical concentration testing remains the basis, which is why specifications require dosing metering accuracy and emphasize online monitoring. The on-site approach given in the article "Coal Chemical Circulating Water Operation and Maintenance from the Perspective of GB/T 50050—2017" can serve as a reference: taking non-oxidizing biocides such as isothiazolinone (1.5% content) as an example, the general dosage is 100~150 mg/L, and it is explicitly stated as "based on holding water volume"—only when the basis is clearly defined can costs be calculated.
VIII. 11 Lines of Real Engineering Accounts
The following 11 lines cover six scenarios: thermal power, steel, oil refining, nitrogen fertilizer, new chemical materials, and data centers. Any data derived from supplier statements or commercial technical materials are separately marked as "not peer-reviewed."
| System / Source | Concentration Action | Water Balance | Acid Balance / Chemical Balance | Effect and Boundary |
|---|---|---|---|---|
| Xuangang Power Plant thermal circulating water (engineering paper, Lin Keming) | Add sulfuric acid to increase cycles of concentration | Cycles 1.9→3.3; makeup water 1 545.3→1 050.3 t/h, water saving 495 t/h, monthly water saving 35.64 万 t, annual water saving cost about 170 万 yuan | Daily acid dosing 200~250 kg, acid price at 1 元/kg, monthly increase 7 500 元; after deducting acid dosing system investment and acid consumption, annual benefit 130 ten thousand yuan | pH controlled at 8.3~8.8, pump started when total alkalinity ≥7 mmol/L; at 3 cycles of concentration, SO₄²⁻ about 400 mg/L; coupon/test tube corrosion rate 0.0035 / 0.0028 mm/a |
| Jinxi Petrochemical No. 1 and No. 9 circulating water plants (China National Petroleum Corporation official website, 2021-05) | Add acid to reduce total alkalinity and adjust pH | Annual makeup water saving 19 万 t | Annual cost saving 55 万 yuan (including chemicals and auxiliary materials lost with blowdown) | Stable operation for 1 months; makeup water, blowdown, and wastewater treatment volume all declined for three consecutive periods; specific cycles value not disclosed |
| Ningxia Petrochemical Utilities Department (public report) | Dynamically adjust side-stream filter backwash frequency and water quality monitoring | Circulating water makeup 153 t/h, year-on-year decrease 48 t/h; circulating water system annual water saving over 17 万 m³ | — | At the plant level, reported "cycles of concentration stable at about 4.2"; elsewhere in the same report, "ensure cycles of concentration stable at above 5", the two statements have different qualifiers |
| Tianjin Petrochemical (China Energy Conservation Network) | Introduce municipal reclaimed water and desalinated seawater to replace fresh water, with simultaneous chemical optimization | 1~5 月 circulating water system consumption decreased year-on-year by 10% (previously used over 870 ten thousand t of fresh water annually) | Consumed 110.99 万 t of desalinated seawater and 165.77 万 t of municipal reclaimed water | Cycles of concentration increased from 4.8 to 5.67, better than the headquarters assessment target of greater than 3.5 |
| Refinery circulating water plant phosphorus-free program (Industrial Water Treatment) | Phosphorus-free formulation, cycles of concentration based on calcium hardness maintained at 4~5 | Reused water accounts for 30%~40% of system makeup water, annual fresh water saving about 71 万 m³ | Phosphorus-free formulation | Total iron <1.0 mg/L; corrosion rates of coupons and test tubes for three material types meet standards; adhesion rate meets refinery requirement of ≤20 mg/(cm²·month); after 3 年 of operation, key heat exchanger 110-E-150 showed no obvious scaling or corrosion |
| Industry review (Petrochemical Equipment Management Network) | Increase cycles of concentration of circulating cooling water system | When circulating water volume is 10 000 m³/h, cycles 3.0→5.0: makeup water 166→138 m³/h (water saving 28 m³/h, 16.9%); blowdown 56→28 m³/h (emission reduction 50%) | — | Circulating cooling water system water consumption accounts for about 35% of total enterprise water intake; the prerequisite for increasing concentration is that the system can operate in closed mode, V/R ratio reduced to 1:3~1:4, and supply-return water temperature difference increased to about 8℃ |
| Kaiyang Chemical circulating water system II (chemical screening experimental study) | Add acid to adjust pH to 8.0~8.5 | Under natural pH equilibrium, cycles can only reach a maximum of 4 | After acid dosing, total alkalinity can be controlled at 100~200 mg/L | At 6 cycles, calcium ions plus natural total alkalinity 1 145 mg/L (exceeds 1 100), RSI 3.27 (below 3.3), both triggered simultaneously; the original text has errors in the name and threshold citation for RSI |
| A power plant Unit #2 (compiled by Tianxin Chemical, not peer-reviewed) | Add acid to reduce alkalinity and increase cycles of concentration | Cycles 2.5~3.0→5.0~5.5; average water supply 165→83.8 t/h (decreased by about half); weak acid cation bed regeneration 0.5→0.2 cycles/day | Annual comprehensive cost decreased by 457 800 元 | Control standards: alkalinity 2.0~3.0 mmol/L, pH 8.0~8.6, hardness <2.8 mmol/L |
| Beixing Precision silicon carbide electrode cooling (Kechuang China technology demand) | Use Puckorius scaling index to determine makeup water and acid dosing ratio | Annual cooling water 31 933 t | Annual use of 92.5% sulfuric acid 4.35 t (cost figure [to be verified]) | At 3 cycles of concentration, in stable condition, basically no scaling after two years of operation, corrosion significantly reduced; graphite electrode lifespan extended from 1 年 to 2 年, annual electrode cost saving 180 万 yuan |
| Data center circulating water system (Veolia case, supplier self-report) | Add sulfuric acid to reduce pH and alkalinity + dispersant + automatic pH control | Cycles of concentration 4→8; water consumption decreased by 50%, water saving over 1 200 万 gallons (about 4.5 万 m³) | Combined water and chemical savings of about 15 万 USD | The replicable point of this case is "first identify that the alkaline program suppressed cycles, then add acid and control loop" |
| A Shandong chemical group (Fuyu Water materials, supplier self-report) | Electrochemical treatment + side-stream filtration + automatic blowdown | Cycles increased to above 5, daily makeup water saving 1 200 t, water saving rate 29%, blowdown reduction 69% [to be verified] | Significantly reduced chemicals | Same material states 150 t/h concentrated brine reuse project achieved 15~20 cycles, expected annual reduction of circulating water blowdown 70 万 m³ [to be verified] |
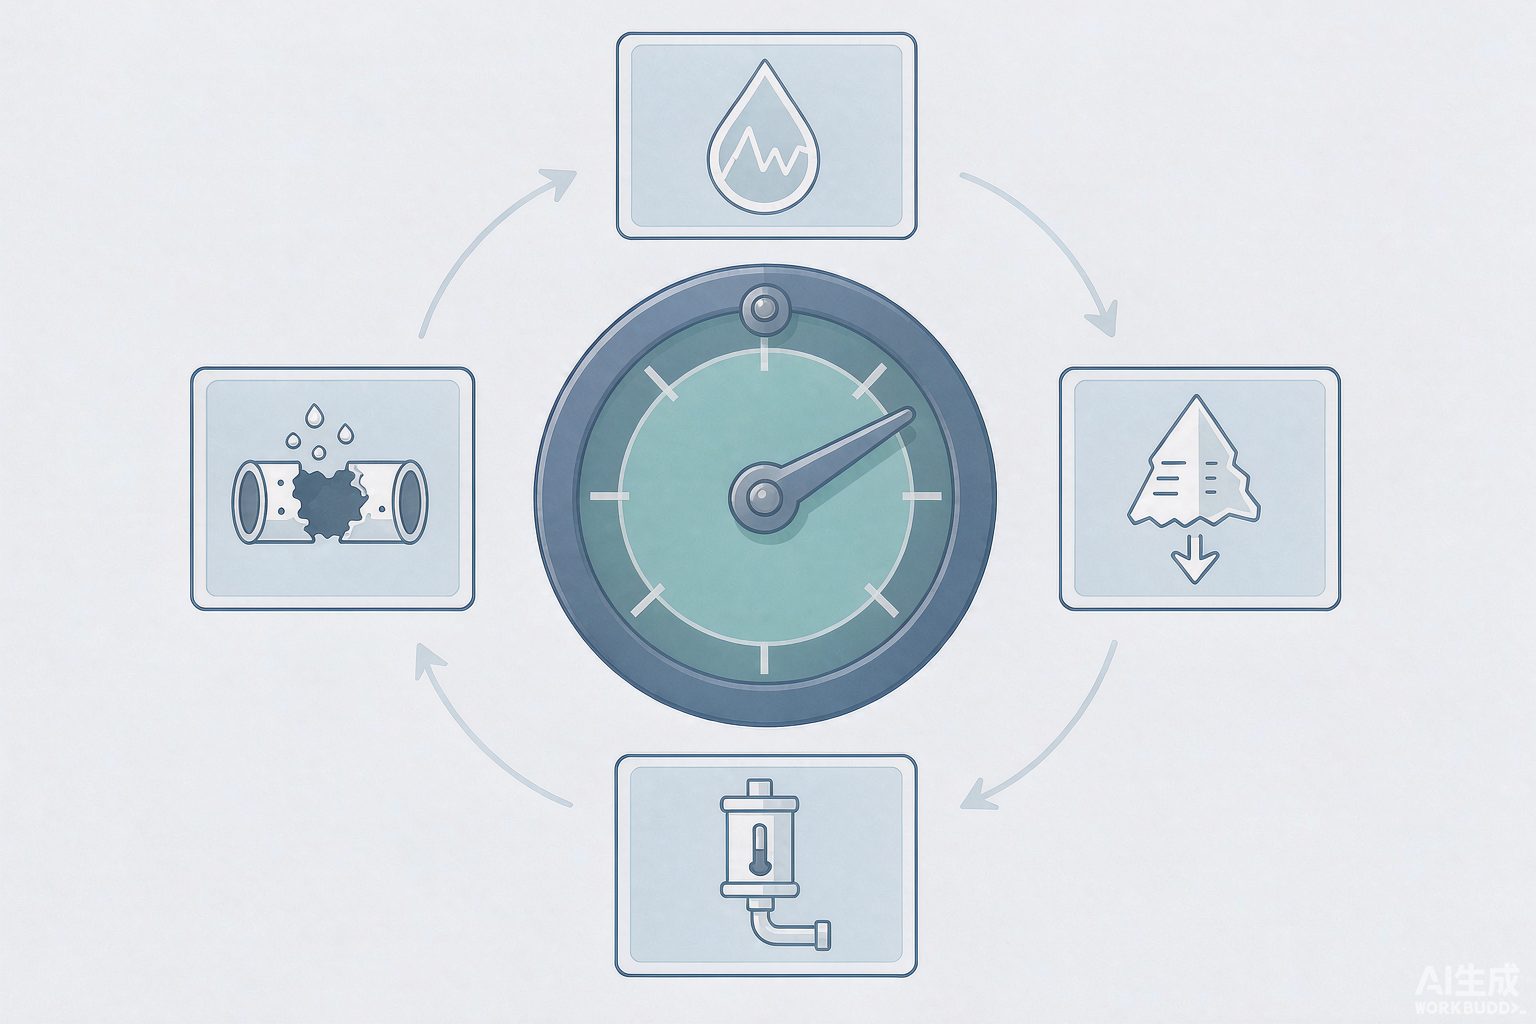
IX. Six Engineering Truths
1. A concentration ratio without a qualifier is not data. "Calculated as chloride" and "calculated as calcium hardness" can differ by an order of magnitude on the same system, while "including windage loss" and "excluding windage loss" differ by a factor of 1.53. Any technical discussion premised on the concentration ratio—chemical formulation, acid dosage, material selection, water-saving accounting—must first fill in this qualifier; otherwise, the discussion is not about the same operating condition at all.
2. Increasing concentration is not free water saving; it trades a water account for an acid account plus a corrosion account. Clause 3.1.11 of the standard requires pushing it upward, while Clause 3.1.10 requires braking at 1 100 mg/L and RSI 3.3; the gap in between must be paid for with acid dosing, softening, or chemicals. With acid dosing in particular, note that it "transfers" rather than "eliminates": the alkalinity of HCO₃⁻ becomes SO₄²⁻ and remains in the water, still requiring blowdown to carry it away; and switching to hydrochloric acid introduces chloride ions, pushing the corrosion problem onto stainless steel. There is only one truly free outlet—close the system, stop leaks and losses, push down the V/R ratio, and raise the supply-return water temperature difference.
3. 0.075 mm/a is an annualized average for the heat transfer surface, not a safety margin for piping. It corresponds to the "water side of equipment heat transfer surfaces," whereas field coupons are usually on bypass lines at lower temperatures; it is an average, and pitting corrosion does not care about averages. Converted to an intuitive quantity, 0.075 is roughly equivalent to 20 年 cumulative 1.5 mm; for carbon steel pipe with a wall thickness of 4 mm, this may appear to leave margin—but a pit 3 mm deep is already enough to perforate, and that pit may contribute less than 0.01 mm/a to the average.
4. 0.005 mm/a is 15 times stricter than 0.075 mm/a; do not get the direction backwards. The limit for stainless steel is stricter because it relies on a passive film rather than wall thickness allowance. This also explains why "chloride ions are particularly hostile to stainless steel"—chloride ions attack precisely the passive film, and its limit inherently has only one order of magnitude of room.
5. The three residual chlorine bases for biocides must not be mixed. Continuous dosing corresponds to 0.1~0.5 mg/L; shock dosing corresponds to 0.5~1.0 mg/L and only needs to be maintained for 2~3 h; the standard water quality indicator table separately gives a permissible free chlorine value at the return water main of 0.1~1.0 mg/L. Treating the shock value as a continuous control value amounts to long-term over-chlorination—it does two bad things at once: it raises the concentration ratio calculated as chloride, and it makes the corrosion environment for stainless steel harsher. Also note the interference of ammonia nitrogen: ammonia nitrogen reacts preferentially with available chlorine, consuming the biocide and making actual free chlorine lower than the control lower limit, which is one reason the standard sets a limit on ammonia nitrogen.
6. Microbial indicators use "should preferably not exceed," not "pass line." Total heterotrophic bacteria count 1×10⁵ CFU/mL and biological slime volume 3 mL/m³ are control-oriented values. The harm of biological slime is disproportionate to its thickness—it is a poor conductor of heat, and a thin biofilm can significantly reduce heat transfer; more troublesome is that the anoxic zone beneath the film breeds sulfate-reducing bacteria, causing deep pitting in places no one can see, while the corrosion rate measured in the bulk water may still be "acceptable." Therefore, biocides and dispersants must be used in pairs: one kills, and the other carries away the stripped slime; otherwise, the stripped material ends up clogging the heat exchanger.
10. Conclusion
The circulating cooling water system is the most "invisible" link in the entire industrial water treatment system—it does not generate pollutants, it only moves heat, and it appears to have neither the complexity of biological systems nor the technical sophistication of membrane systems. But precisely because of this, it is the link most easily summed up by a single phrase: "concentration ratio 5.0."
Bringing together the three conclusions of this article: The concentration ratio is a ratio, so it naturally inherits two uncertainties—what quantity is used, and who is counted in the denominator; and it is also a target pulled from both above and below by standards—raising it is for water saving, lowering it is for scaling prevention, and the difference in between must be paid for with acid dosing, softening, or chemicals; finally, the set of indicators used to judge whether it is safe (corrosion rate, adhesion rate, fouling thermal resistance, microorganisms) works as a group; citing any one of them alone will lead to overly optimistic conclusions.
The next time you see the phrase "concentration ratio 5.0," it is worth first asking three questions: Calculated as what? Does the denominator include windage loss? And in which column is the account paid for it written?
Manuscript Service Industrial Water Treatment Technology Series · This article is a technical review and clarification of definitions; the cited standard clauses are subject to the officially issued texts, and engineering values should be based on on-site testing and experimental data.
References
- GB/T 50050—2017 "Code for Design of Industrial Circulating Cooling Water Treatment" Clause 3.1.5 (control conditions and indicators for heat exchange equipment).
- GB/T 50050—2017 "Code for Design of Industrial Circulating Cooling Water Treatment" Clause 3.1.6 (fouling thermal resistance requirements for closed systems).
- GB/T 50050—2017 "Code for Design of Industrial Circulating Cooling Water Treatment" Clause 3.1.7 and Table 3.1.7 (circulating cooling water quality indicators for indirect open systems).
- GB/T 50050—2017 "Code for Design of Industrial Circulating Cooling Water Treatment" Clause 3.1.10 (sum of calcium hardness and total alkalinity, stability index limits).
- GB/T 50050—2017 "Code for Design of Industrial Circulating Cooling Water Treatment" Clause 3.1.11 (design cycles of concentration and calculation formula for cycles of concentration).
- GB/T 50050—2017 "Code for Design of Industrial Circulating Cooling Water Treatment" Clause 3.1.12 (total heterotrophic bacteria count and biological slime content).
- GB/T 50050—2017 "Code for Design of Industrial Circulating Cooling Water Treatment" Clause 3.5.2 (dosing methods for oxidizing biocides and residual chlorine control).
- GB/T 50050—2017 "Code for Design of Industrial Circulating Cooling Water Treatment" Clause 3.5.6 (dosage calculation for oxidizing biocides).
- GB 50050—2007 "Code for Design of Industrial Circulating Cooling Water Treatment" (previous edition, for version evolution comparison).
- Science Popularization China · Entry "Cycles of Concentration" (reviewed by Huang Tousheng, North China Electric Power University): chloride ion is not sufficiently representative due to artificial addition; potassium ion method is more accurate.
- Circulating Water System Parameter Conversion (technical article by technical service provider): selection of conservative ions, reasons for elevated conductivity, conversion formulas for makeup water and blowdown.
- Five Key Points of Coal Chemical Circulating Water O&M from the Perspective of GB/T 50050—2017 (technical article): selection of corrosion inhibitors and scale inhibitors, continuous and shock dosing of sodium hypochlorite for residual chlorine, isothiazolinone dosage based on holding water volume.
- How to Calculate the Cycles of Concentration of Circulating Water in Cooling Towers (cooling tower equipment supplier material): four calculation methods and correction factors, derivation of cycles of concentration and water balance.
- Chemical Reagent Screening Test and Research on Circulating Water System of Kaiyang Chemical (National Medium Nitrogen Information Cooperation Network): at 6 cycles, calcium ion plus natural total alkalinity 1 145 mg/L, RSI 3.27.
- Lin Keming. Case Study of Acid Dosing Process Treatment for Thermal Circulating Water (Xuanhua Steel Power Plant): concentration ratio 1.9→3.3, makeup water and blowdown volume, calcium sulfate index and SO₄²⁻ boundary.
- Brief Analysis of Treatment Measures for High Total Alkalinity in Circulating Cooling Water (circulating water treatment technical material): alkalinity and pH control standards after acid dosing, comparison of makeup water and weak acid bed operation.
- China National Petroleum Corporation: Jinxi Petrochemical Strengthens Technical Management for Energy Saving and Consumption Reduction (2021-05): after acid dosing, annual makeup water savings of 19 万 tons, cost savings of 55 万 yuan.
- Related Technologies for Water-Saving and Environmentally Friendly "Zero Discharge" of Circulating Cooling Water (China Energy Conservation Network): calcium carbonate stability index criteria, pHs calculation formula, relationship between total iron control and corrosion.
- Water Saving and Emission Reduction Technologies for Refining and Chemical Enterprises (Petrochemical Equipment Management Network): comparison of makeup water and blowdown for cycles of concentration 3.0→5.0, V/R ratio and supply-return water temperature difference.
- Tianjin Petrochemical Circulating Water Consumption Reduced Year-on-Year by 10% (China Energy Conservation Network): comparison of cycles of concentration 4.8→5.67 with headquarters assessment indicators.
- Application of Phosphorus-Free Water Treatment Scheme in Refinery Circulating Water System ("Industrial Water Treatment"): cycles of concentration based on calcium hardness, corrosion rate of coupons and test tubes, adhesion rate.
- Veolia Water Technologies: Data center cooling tower program case study: cycles of concentration 4→8, water consumption reduced by 50% (supplier case).
- Technical Research on Electrode Circulating Cooling Water for Silicon Carbide Smelting Furnace (Science and Innovation China Technical Demand): Puckorius scaling index to determine acid dosing ratio, stable operation at 3 times concentration, extended electrode life.
- Chemical Instrument Network: What Corrosion Rate of Carbon Steel in Circulating Water Is Considered Qualified — Three Criteria Examined Together: definitions of corrosion rate, adhesion rate, fouling thermal resistance and pitting corrosion discussion.
- Fabric o. Cooling Water Treatment: Scale, Corrosion and Biofouling: LSI and RSI only describe calcium carbonate driving force, not general corrosivity.
- SYWATER Circulating Water Quality Analysis Software Technical Description: LSI, RSI, PSI three-index direction comparison and grading table, limitations of LSI prediction after chemical dosing.