



 Nationwide multi-industry (polluting units such as municipal wastewater treatmen
 Single station with 1 discharge outlet and 4–7 indicators (COD / ammonia nitroge
Wastewater Online Monitoring: The Gap Between Instrument Readings and Lab Results Is Not Error, but Definition
Same discharge outlet, same minute, the online instrument and the laboratory give two different numbers. Most of that difference is not an instrument accuracy problem.
At the wastewater main discharge outlet of a pollutant discharging unit, several sets of online instruments for COD, ammonia nitrogen, total phosphorus, total nitrogen, pH and flow are installed, and data are uploaded every hour. On the day of enforcement comparison or acceptance, the laboratory takes samples simultaneously and measures once, and the two numbers often fail to match: some differ by a few percentage points, some differ by a factor of two, and some even point in opposite directions. The explanation usually heard is "the instrument is inaccurate." But when you really break it down, you find that these two numbers have not been the same thing since the moment of sampling — what the online instrument measures is mostly a composite water sample, while what the laboratory collects is a grab water sample; the online instrument measures the kind of water for which it was calibrated, while the laboratory measures that day's bucket of water; and the "passing lines" for the two numbers are written in different volumes of specifications, with different values. This article breaks down several of the most easily confused definitions in the HJ 353/354/355/356 set of standards.
I. First Lay Out the "Three Numbers": 90%, 75%, 2 mg/L
Before discussing whether the instrument is accurate, three numbers must first be clearly distinguished, because they are often verbally lumped into one sentence: "the online data is non-compliant."
The first number is 90%. HJ 355—2019 defines the "valid data rate" as: the ratio of the number of valid data actually obtained by the instrument within a certain period to the number of valid data that should be obtained within that period; and stipulates that with a month as the period, this ratio shall not be less than 90%. It is an assessment line, governing "how much work this set of instruments actually did in a month."
The second number is 75%. HJ 356—2019 states in the "valid daily average" section: the valid daily average is the average of all valid monitoring data of a certain pollutant within one day, and the number of valid monitoring data participating in the statistics shall be no less than 75% of the number of data that should be obtained on that day (the same chapter also stipulates that when the flow is zero, the monitoring value output by the online system is invalid data). It is not an assessment line but a threshold — if it is not reached, no legal daily average can be calculated for that day at all.
The third number is 2 mg/L. This is the corrected value for COD. HJ 356 stipulates that when the monitoring value is zero, a negative value within the zero-point drift limit range, or below the instrument detection limit, and is judged to be valid data, it shall be substituted into the statistics as a corrected value: CODCr takes 2 mg/L, ammonia nitrogen takes 0.01 mg/L, total phosphorus takes 0.005 mg/L, and total nitrogen takes 0.025 mg/L.
Putting these three numbers on the same day, the problem emerges. The instruments for COD, ammonia nitrogen, total phosphorus and total nitrogen measure composite water samples and output 1 sets of averages per hour, so the theoretical required data for one day is 24 sets. Thus 75% falls on 18 sets. Suppose that on a certain day the instrument obtains only 19 sets of valid data: 19 ÷ 24 = 79.2%, and a legal daily average can be calculated for that day (19 ≥ 18); but if every day in the month has only 19 sets, the monthly valid data rate is 79%, lower than 90%, and the assessment fails. Conversely, if on a certain day only 17 sets are obtained (70.8%), no legal daily average can be calculated for that day, but if the remaining 29 天 of the month all obtain the full 24 sets, the monthly valid data rate is still higher than 90%.
There is another more subtle reason why these two figures cannot substitute for each other: although their denominators are both written as "the number of data that should be obtained", the modifiers of the numerator and denominator differ. In the definition of HJ 355, "the number of valid data actually obtained" is divided by "the number of valid data that should be obtained", with both numerator and denominator carrying the word "valid"; whereas 75% in HJ 356 compares "the number of data that should be obtained on that day". In addition, HJ 356 explicitly stipulates that monitoring values output during shutdown, fault repair or maintenance, and calibration and verification periods are all invalid data—so whether long-term equipment shutdown is counted in the denominator for indicators such as 90% is not further elaborated in the main text of the standard. Different platforms and different assessment methods are not consistent on this point: some calculate by multiplying "data transmission rate × data valid rate", and two 90% multiplied together leave only 81%. This is the point most easily manipulated and most easily misjudged in the field.
II. Three Gates: The Same Item Has Different Values in the Three Volumes of the Standard
The "actual water sample comparison test" is to measure the same stream of water simultaneously with an online instrument and a laboratory method, and is the formal action for determining whether an instrument is accurate. It appears in three places: installation and commissioning, acceptance, and daily operation. Most people assume that the indicators at these three gates are consistent—after all, only instruments that pass acceptance are put into use. However, a item-by-item check reveals that among the five categories of indicators (COD, ammonia nitrogen, total phosphorus, total nitrogen, pH), only one has different values across the three volumes, and it happens to be total phosphorus.
| Parameter | Installation and Commissioning (HJ 353 Table 3) | Acceptance (HJ 354 Table 2) | Operation (HJ 355 Table 1) |
|---|---|---|---|
| COD actual water sample <30 mg/L | Substitute with 20~25 mg/L standard sample, ±5 mg/L | Substitute with 20~25 mg/L standard sample, ±5 mg/L | Substitute with 20~25 mg/L standard sample, ±5 mg/L |
| COD 30~60/60~100/≥100 mg/L | ±30%/±20%/±15% | ±30%/±20%/±15% | ±30%/±20%/±15% |
| Ammonia Nitrogen <2 mg/L | Substitute with 1.5 mg/L standard sample, ±0.3 mg/L | Substitute with 1.5 mg/L standard sample, ±0.3 mg/L | Substitute with 1.5 mg/L standard sample, ±0.3 mg/L |
| Total Nitrogen <2 mg/L | Substitute with 1.5 mg/L standard sample, ±0.3 mg/L | Substitute with 1.5 mg/L standard sample, ±0.3 mg/L | Substitute with 1.5 mg/L standard sample, ±0.3 mg/L |
| Total Phosphorus <0.4 mg/L | Substitute with 0.3 mg/L standard sample, ±0.06 mg/L | Substitute with 0.3 mg/L standard sample, ±0.06 mg/L | Substitute with 0.2 mg/L standard sample, ±0.04 mg/L |
| pH actual water sample | ±0.5 | ±0.5 | ±0.5 |
The Total Phosphorus row deserves a separate look: installation and commissioning and acceptance use the 0.3 mg/L standard sample as substitute, with an allowable deviation of ±0.06 mg/L; by routine operation, the 0.2 mg/L standard sample is used instead, and the allowable deviation is tightened to ±0.04 mg/L. In other words, operation is stricter than acceptance—a Total Phosphorus instrument that "passes acceptance" may not necessarily pass the comparison during the operation period. And this brings up an engineering consequence: the daily average limit for Total Phosphorus at Grade A of urban sewage treatment plants is 0.5 mg/L, and the instantaneous value is 1 mg/L (2026 年 3 月 1 日 onwards), yet the comparison during the operation period uses the concentration point of 0.2 mg/L, which is far below the discharge limit—what is being tested is the instrument's resolving capability at the low-concentration end, not its ability to report "exceedance".
Besides the limits, there is also a quantity rule that is easily overlooked: the total number of comparison tests should be no less than 3 pairs; for 3 pairs, at least 2 pairs must meet the requirements; for 4 pairs, at least 3 pairs; for 5 pairs or more, at least 4 pairs must meet the requirements. It is not the case that only "all passing" counts as passing, nor that "passing on average" counts as passing.
III. The four tolerance bands for COD: the higher the concentration, the smaller the allowable deviation
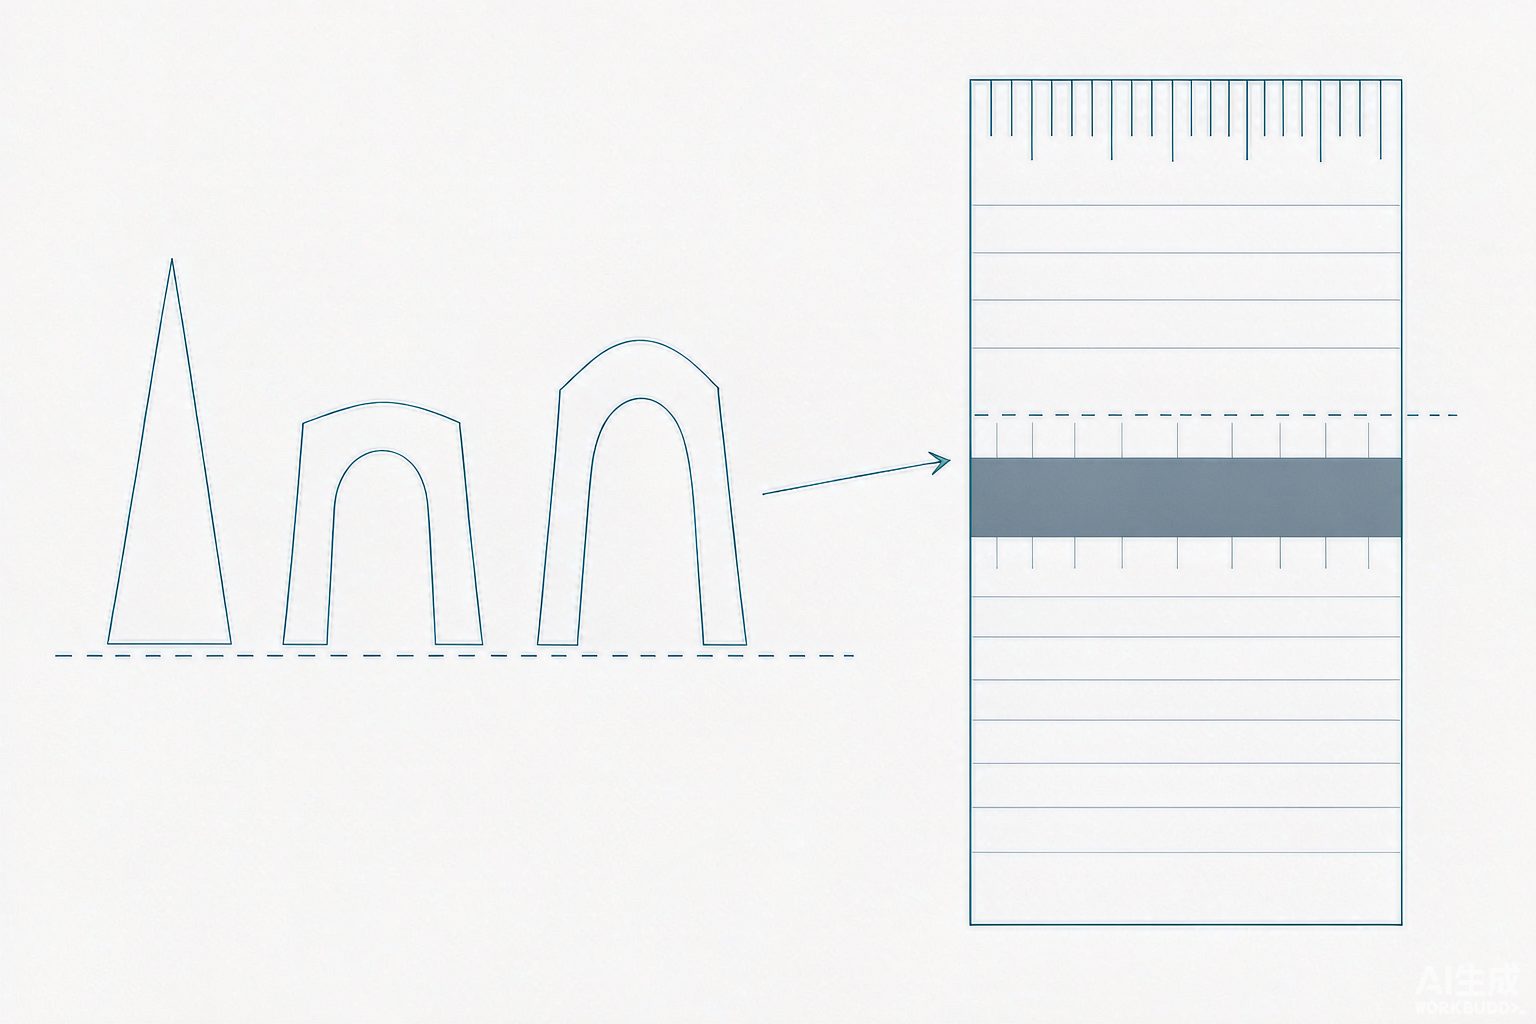
The actual water sample comparison for COD is divided into four bands, and the direction is worth noting:
| Actual Water Sample COD Range | Determination Method | Converted to Absolute Amount |
|---|---|---|
| <30 mg/L | Substitute with 20~25 mg/L standard sample, ±5 mg/L | ±5 mg/L (approximately near the upper limit of ±16.7%) |
| 30~60 mg/L | Relative error ±30% | ±9~18 mg/L |
| 60~100 mg/L | Relative error ±20% | ±12~20 mg/L |
| ≥100 mg/L | Relative error ±15% | ±15% and above |
The low-concentration tier does not use relative error, but rather an absolute limit based on "substituting a different standard sample for measurement"; and moving from ±15% at ≥100 mg/L toward lower concentrations, the allowable relative deviation first relaxes to ±20%, then further relaxes to ±30%. This is precisely the step that inevitably appears when connecting the two rulers of "absolute error" and "relative error"—the lower the concentration, the larger the proportion of fixed instrument error in the measured value, and the worse the relative error naturally looks, so the standard switches to an absolute amount at the low-concentration end. Looking at the 30~60 mg/L tier separately, the ±30% allowance is actually the most lenient of the four tiers (at 60 mg/L, ±18 mg/L is allowed).
IV. When the range is set to 2~3 times the limit value, which limit value is it?
Article 5.1.1 of HJ 355—2019 contains only one sentence: the range of online monitoring instruments should be reasonably set according to the actual on-site effluent concentration of water samples, and the upper range limit should be set to 2~3 times the limit value of the pollutant discharge standard implemented on site; when the actual effluent concentration of water samples exceeds the range setting requirements, manual monitoring shall be used.
Before the amendment sheet to GB 18918—2002, this sentence had only one ambiguity (which limit value is "the discharge standard limit value implemented on site"). After the amendment sheet (implemented from 2026 年 3 月 1 日), the issue became specific: for the four parameters COD, ammonia nitrogen, Total Nitrogen, and Total Phosphorus, there are simultaneously two sets of limit values—daily average values and instantaneous values—and exceeding either limit constitutes an exceedance; for the three parameters pH, color, and fecal coliform count, the assessment was changed from daily average values to instantaneous values.
| Indicator (Grade I-A) | Daily Average Limit | Instantaneous Value Limit (from 2026-03-01) | Range at 2~3 times the Daily Average |
|---|---|---|---|
| COD | ≤50 mg/L | ≤75 mg/L | 100~150 mg/L |
| Ammonia Nitrogen | ≤5 mg/L | ≤10 mg/L | 10~15 mg/L |
| Total Nitrogen | ≤15 mg/L | ≤20 mg/L | 30~45 mg/L |
| Total Phosphorus | ≤0.5 mg/L | ≤1 mg/L | 1.0~1.5 mg/L |
When answering "how should the range be set after the amendment takes effect," the Yunnan Provincial Department of Ecology and Environment stated: the upper range limit may be reasonably set based on the daily average limit of the pollutant discharge standard in the pollutant discharge permit and the actual on-site pollution discharge conditions. This leads to a consequence that must be carefully considered—the range is a single knob, yet it governs two things at once: whether the upper limit is high enough determines whether an instantaneous exceedance can be recorded; whether the lower limit is low enough determines whether values in the low-concentration range still have resolution. If the range is set at 100~150 mg/L based on a COD daily average of 50 mg/L, the instantaneous limit 75 mg/L falls at 50%~75% of the range and can still be recorded; but if a plant's effluent COD is consistently only 15~20 mg/L, under the same range this concentration occupies only 10%~20% of full scale, while the assessment points for 24 h drift are precisely 20% and 80% of the upper range limit—readings at the low-concentration end will be the first to be consumed by drift.
V. The UV Method Is Not "Another Way to Measure COD"
Online COD instruments follow two mainstream routes: one instruments the laboratory dichromate method (digestion—colorimetric/titration), and the other is the ultraviolet absorption method (UV). In the old specification of version 2007, the UV water quality analyzer was a type of instrument explicitly listed; HJ 354—2019 and HJ 355—2019 both removed the requirements for UV instruments, and the comparison instrument listed for the acceptance and operation stages was changed to the TOC analyzer. This deletion itself explains the issue better than any data.
The reason lies in the principle: the dichromate method measures "the total amount of reducing substances that can be oxidized by potassium dichromate," and the detection result directly corresponds to the definition of COD; the ultraviolet absorption method measures the absorbance of a water sample in the ultraviolet band, and it responds only to organic substances containing conjugated double bonds and aromatic rings. Low-molecular-weight organic substances such as alcohols and sugars hardly absorb at all, so what it outputs is an "optically equivalent COD," which must be converted using a conversion coefficient. And this coefficient is precisely calibrated using the results of the national standard dichromate method on the same type of water—it is calibrated accurately on one kind of water, but on another kind of water, what it measures is a different quantity.
| Comparison Item | Dichromate Method (Instrumented Online) | Ultraviolet Absorption Method (UV) |
|---|---|---|
| What is measured | Total amount of oxidizable reducing substances | Absorbance in the UV band, converted by a coefficient into "optically equivalent COD" |
| For alcohols and sugars | Oxidizable, can be measured | Essentially no response, results read low |
| Data traceability | Directly corresponds to HJ 828 | Conversion coefficient is calibrated from dichromate method results |
| Applicable water bodies | Broad, including Industrial Wastewater with highly variable matrices | Water with a stable matrix (e.g., effluent from municipal sewage treatment plants) |
| Reagents and waste liquid | Consumes strong acids and chromium-containing reagents; waste liquid must be collected and disposed of in accordance with GB 18597 | No reagents, virtually no secondary pollution |
| Which fails first when the matrix changes | Essentially unaffected | Conversion coefficient becomes invalid, deviation is amplified |
This explains a common phenomenon: a UV instrument "performs very well" at the effluent outlet of a sewage treatment plant where Domestic Sewage dominates and water quality is stable, but when the same instrument is moved to an Industrial Wastewater outlet where water quality changes as the process switches, large deviations appear. Data from publicly available materials show that: because the readings of a UV instrument are themselves calibrated using the results of the national standard dichromate method, the relative error between two measurements of the same water sample can be made very small (the materials give a maximum of about 5.5%); under conventional water bodies, the average relative error of the UV method is about 3.5%, while that of the dichromate method is about 1.5%.The statement "the UV method is very accurate" holds only under very narrow preconditions—it is accurate for the type of water on which it was calibrated.
VI. Sampling Points, Those 50 Meters, and a Pipe
Where the readings come from matters more than whether the readings are accurate. HJ 353—2019 sets clear location requirements for sampling points: the water intake should be installed in front of the flow monitoring weir/trough, at a location where the flow is fully mixed after confluence; located in the center of the flow path at the head of the standardized metering weir intake; oriented in the same direction as the water flow; and a manual sampling port must be provided—this single port is the prerequisite that enables comparison monitoring and regulatory sampling to hold up.
The regulations for the monitoring station building are specific: the usable floor area of a newly built station building shall be no less than 15 m², the height no less than 2.8 m, and it should be as close as possible to the sampling point, with the distance to the sampling point being less than 50 m. When the Yunnan Provincial Department of Ecology and Environment was asked whether "these 50 meters" refers to a straight-line distance or pipe length, it clarified: it refers to the distance between the station building and the sampling point (water intake), and does not explicitly specify the sampling pipe length, but to ensure the timeliness and accuracy of sampling, the sampling pipe length should be as short as possible.
On the matter of pipe material, secondary sources and the standard text diverge, which is worth pointing out. Many equipment documents state "polytetrafluoroethylene or stainless steel is recommended," whereas Article 5.4.7 of HJ 353—2019 states: the piping of the water quality automatic sampling unit shall use high-quality rigid pipes such as polyvinyl chloride (PVC) and polypropylene random copolymer (PPR) that do not affect the analysis results, and should preferably be installed as exposed pipes with the flow direction marked. These are not the same requirement. In addition, Article 5.4.3 stipulates that COD, ammonia nitrogen, total phosphorus, and total nitrogen analyzers measure mixed water samples, while the pH meter and thermometer measure in situ or measure instantaneous water samples—within the same system, some parameters report the average of mixed samples while others report instantaneous values, which is itself a source of "the two numbers don't match."
There is another detail that is easily overlooked: the standard allows filtration and other pretreatment devices to be installed before the water quality automatic analyzer, but explicitly requires that excessive filtration should be prevented, and that the actual water sample comparison results after filtration must still meet the performance indicators for the commissioning period. In other words, pretreatment may be used, but one cannot filter out the particulate fraction of the load and then claim to have measured accurately.
VII. Invalid Data: A List of "Legitimate Exclusions"
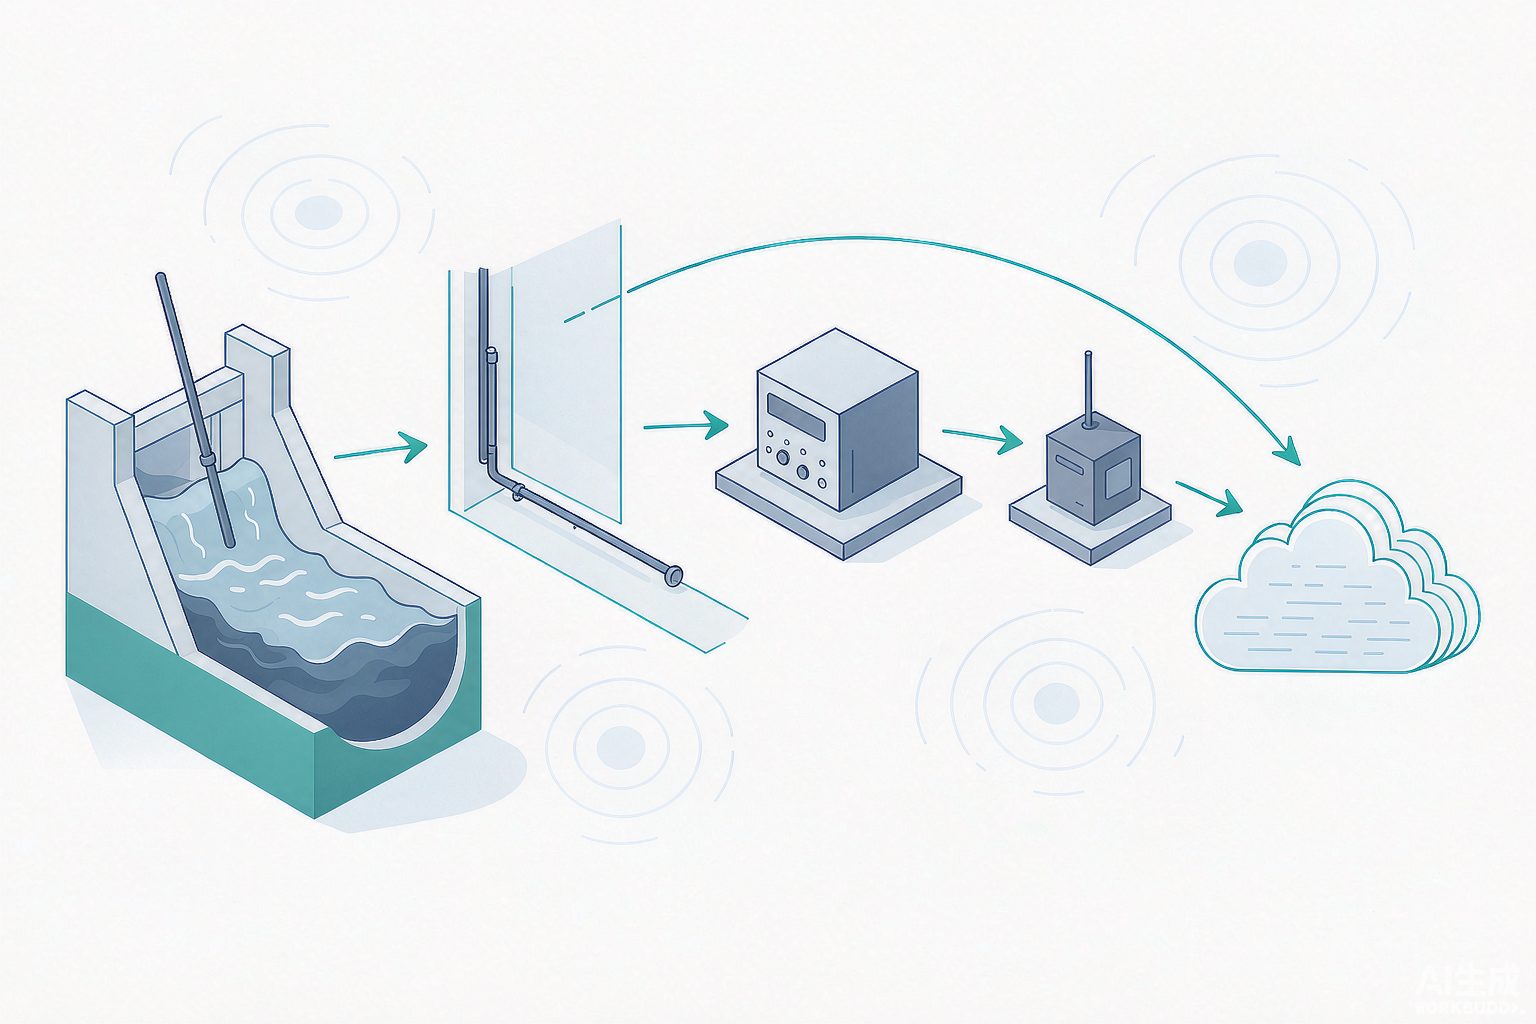
The physical chain of an online monitoring station is actually quite short: discharge outlet sampling point → sampling pipeline → water quality automatic analyzer → data acquisition and transmission instrument → monitoring platform. If any link in this chain has a problem, it will ultimately be settled in the form of "this data cannot count." What HJ 356—2019 does can be understood as establishing a list for "this number doesn't count." Interestingly, it lists both "what counts as valid" and "what counts as invalid," and the latter is retroactive.
| Clause | Circumstance | Determination |
|---|---|---|
| 6.1.2 | The monitored value is zero, a negative value within the zero-point drift limit, or below the instrument detection limit | Identification is required through quality control means such as on-site inspection, actual water sample comparison, and standard sample testing; if it is indeed caused by an excessively low actual emission concentration, it is still valid data |
| 6.1.3 | The monitored value rises sharply, falls sharply, or remains continuously unchanged | Identification through quality control means is required before determining how to handle it |
| 6.2.1 | Flow is zero | The monitored value is judged as invalid data |
| 6.2.2 | The data error among the instrument, the data acquisition instrument, and the platform exceeds 1% | The data received by the platform is judged as invalid data |
| 6.2.3 | Standard sample testing or actual water sample comparison fails | All data from this failure moment back to the last passing moment are invalid |
| 6.2.4 | During shutdown, fault repair, maintenance, calibration, or verification | The output value is invalid data, but must be marked and retained as the basis for instrument inspection and calibration |
The traceability of Clause 6.2.3 is the sharpest item in this list: one failed comparison invalidates the "good-looking data" from the preceding period as well. This also explains why operation and maintenance records must leave a trace—Clause 6.1.4 explicitly states that operation and maintenance records can serve as evidence for determining data validity; Clause 6.1.5 requires that system logs be available for review and likewise serve as determination evidence. Whether data is judged valid or invalid depends not on the readings of the day, but on the records surrounding those readings.
How to fill in invalid periods? The reply from the Department of Ecology and Environment of Hebei Province provides a very specific conversion: invalid data should preferably be replaced by manual monitoring data, and the manual monitoring data per day should be no less than 4 times, and 1 times of manual monitoring data can replace 6 小时 of automatic monitoring data—4 times multiplied by 6 小时 exactly covers a full day. This correspondence of "4 times × 6 h = 24 h" is the key to clearly defining the matter of "replacement": it is not about filling in a few random numbers, but a one-to-one correspondence based on the number of hours.
VIII. The Real Ledger: Qualified Quality Control Samples Do Not Equal Qualified Actual Water Samples
The following public reports from the government and enterprises put the above criteria into specific values. Most of them report two sets of results at the same time: quality control sample (standard sample) assessment and actual water sample comparison. Looking at the two sets together reveals a recurring phenomenon.
| Time / Unit | QC Sample Assessment | Actual Water Sample Comparison Results |
|---|---|---|
| Jinyun County, Zhejiang 2017 年 Q1 (multiple wastewater treatment plants, 3 comparisons per day) | All QC samples passed | Ammonia nitrogen error 32.0%~42.2%, 108%~145%, -29%~106% (limit ±15%); Total phosphorus -5.9%~68.2%, -50.4%~878%; COD absolute error -33.0%~-49.7%, -10.2~70.0 mg/L — numerous failures |
| Fengzhen City Wastewater Treatment Plant, Inner Mongolia 2014 年 Q3 | COD 104/106 (standard value 95~111), ammonia nitrogen 1.33/1.34 (1.25~1.37) passed | COD inlet 259.3/297.6 (12.9%), 318.5/321.5 (0.9%), 378/365.7 (-3.4%); outlet 15.5/16.32 (5.0%), etc., passed |
| Chongqing Chenyuan Environmental Protection (2026 年 1 月, Yu Huan Gai [2026] No. 15) | — | Ammonia nitrogen 41.1%/-2.3%/16.4% (2 of 3 pairs exceeded ±15%); Total nitrogen -39.2%/-43.2%/-77.3% (all 3 pairs failed) |
| Ningling County Third Wastewater Treatment Plant, Henan (2025 年 7 月, decision of no penalty) | — | Automatic COD 2.887, manual 12 mg/L; automatic ammonia nitrogen 0.004, manual 0.106 mg/L |
| Mengxu Town and Shilong Town Wastewater Treatment Plants, Guiping City, Guangxi (Supervision Issue No. 16) | COD standard sample comparison error 58% (limit ±10%) | Data missing or persistently at 0; each plant fined 28996 元 |
| Nantong Gaomeng New Materials, Jiangsu (2024-03-29 comparison report) | COD 482.5/500 (-3.5%), ammonia nitrogen 44.90/45 (-0.22%) passed | COD 140.7/125 (13%), 148.8/131 (14%), 164.9/150 (9.9%) passed |
The Jinyun column presents the problem most clearly: in the same batch of comparisons, all QC samples passed, while actual water sample comparisons failed on a large scale; some indicators deviated to the magnitude of 108%~878%. This is not a case of faulty instruments — standard samples are a clean matrix, whereas actual wastewater carries color, turbidity, chloride ions and substantial matrix interference. The criterion is therefore straightforward: QC sample assessment tests the instrument's state in an ideal matrix, while actual water sample comparison tests its state in real wastewater — the two are separate matters. Running a standard solution once during acceptance and concluding the instrument is fine because the results look good precisely bypasses the real test of matrix interference.
The Fengzhen column is the opposite—what a qualified comparison ledger looks like: three time points each at the inlet and outlet, with errors all within the allowable range, and both quality control samples and actual samples passing the comparison. The Ningling column (automatic COD 2.887, manual 12) is the most typical form at the low-concentration end: when the range is far greater than the actual concentration, the instrument reading will "lie" near the detection limit, and the laboratory's one-time sampling result is instead closer to the true matrix state.
IX. Criteria and "Constant Values": What the Standard Requires to Be Identified Is Exactly the Fingerprint Left by Tampering
Article 6.1.3 of HJ 356 requires the use of quality control means to identify monitoring values that "rise sharply, fall sharply, or remain continuously unchanged." Looking back at publicly reported cases of automatic monitoring data fraud in recent years, one finds that the technical traces they left almost all fall into these three forms—especially constant values and zero values.
| Case | Practice | Traces Left in the Data |
|---|---|---|
| An environmental technology company in Changxing, Huzhou, Zhejiang (2021) | Added a "COD removal agent" (main ingredient sodium chlorate, actually a masking agent that does not truly remove COD but only interferes with measurement) to discharged wastewater | Automatic COD monitoring values dropped abnormally and became distorted; the first case nationwide in which criminal liability was pursued for this means, with a corporate fine of RMB 20 万 and the person in charge sentenced to one year in prison with a one-year-and-six-month suspended sentence |
| A food company in Xinyi, Jiangsu (2021) | Frequently and deliberately stopped the water quality sampler, letting the instrument analyze the water sample retained in the sampling tube; and substituted actual water samples with samples below the discharge standard | COD, ammonia nitrogen, and suspended solids values repeatedly showed constant values (the retained sample could support analysis for about 5 天); 11 people were arrested, and ecological and environmental damage compensation amounted to RMB 54.4136 万 |
| An iron wire company in Wenzhou, Zhejiang (2021) | Shut down the COD instrument without authorization and secretly buried a tap water pipe in the wastewater tank to dilute before discharge | COD data remained constant for more than twenty consecutive hours, while during the same period the wastewater at the discharge outlet regularly changed from turbid to clear; 6 people were criminally detained |
| A printing and dyeing company in Wenzhou, Zhejiang (2021) | When ammonia nitrogen data exceeded the standard, repeatedly entered the station room to switch the equipment power supply and restart/reset to zero | Ammonia nitrogen minute values repeatedly showed abnormal 0 values, while COD and instantaneous flow were normal during the same period |
| A water treatment company in Jinjiang, Fujian (2022 judgment) | — | Constituted the crime of environmental pollution; the entity was fined RMB 1 万, and the responsible person Li was sentenced to seven months in prison and fined RMB 1 万 |
Conversely, an administrative penalty decision of 2026 年 in Wuzhou City shows how to calculate when "the data is not falsified but exceeds the range": when COD displays over-range, enforcement follows the principle that "the part of the measured value not exceeding the upper range limit is valid data, and the part exceeding it is not included in the calculation," with the portion exceeding 1000 mg/L counted as 1000 mg/L; the valid daily average adopts the flow-weighted average method, i.e., multiplying the period flow of each valid monitoring period of the day by the corrected concentration for that period, summing to obtain the total daily discharge, and then dividing by the total daily wastewater volume; on this basis, 10 日 exceeding the standard was verified (511.79~796.33 mg/L), against the COD limit of 500 mg/L for meat processing under GB 13457—92.
Condense this section into five criteria:
1. The difference between instrument readings and laboratory readings should first be split into three things: different sampling time points, possibly different quantities being measured (composite sample vs. instantaneous sample, UV method vs. dichromate method), and different judgment rules. Only after separating these three is what remains the true instrument error.
2. 90% is the assessment line, and 75% is the threshold for "whether a daily average can be calculated for this day." The two numbers cannot substitute for each other, because one is on a monthly basis and the other on a daily basis, one governs instrument attendance and the other governs the representativeness of the day.
3. The range is the only knob, yet it simultaneously determines whether the upper limit can be recorded and whether the lower limit can still be resolved. Setting it at 2~3 times which limit value will directly change the credibility of readings at the low-concentration end.
4. Passing a QC sample does not mean the actual water sample passes. The matrix interference of a clean matrix and real wastewater are two different exams; performing only the former during acceptance is equivalent to leaving the real risk to the operation period.
5. The several data patterns that the standard requires to be "identified"—constant values, zero values, sudden rises and drops—are exactly the fingerprints that falsification leaves on the data surface. To judge whether a curve is normal, first check whether it is "too quiet."
The essence of online monitoring is turning "compliance" from a one-time submission for testing into a continuous curve. The curve brings continuity, and also brings a whole set of rules about "which point counts and which point does not count." What often differs between instrument readings and laboratory readings is not accuracy, but which segment of the curve these two numbers each stand on and which set of specifications' ruler is used to measure them. First distinguish the rulers, then discuss whether it is accurate.
References
- HJ 353—2019 "Technical Specification for Installation of Online Monitoring Systems for Water Pollution Sources (CODCr, NH₃-N, etc.)" (issued by the Ministry of Ecology and Environment, 2019-12-24, implemented from 2020-03-24).
- HJ 354—2019 "Technical Specification for Acceptance of Online Monitoring Systems for Water Pollution Sources (CODCr, NH₃-N, etc.)".
- HJ 355—2019 "Technical Specification for Operation of Online Monitoring Systems for Water Pollution Sources (CODCr, NH₃-N, etc.)".
- HJ 356—2019 "Technical Specification for Data Validity Assessment of Online Monitoring Systems for Water Pollution Sources (CODCr, NH₃-N, etc.)".
- HJ 212—2017 "Data Transmission Standard for Online Monitoring (Surveillance) Systems of Pollutants".
- HJ 828—2017 "Water Quality — Determination of Chemical Oxygen Demand — Dichromate Method"; HJ 535—2009 "Water Quality — Determination of Ammonia Nitrogen — Nessler's Reagent Spectrophotometric Method".
- HJ 636—2016 "Water Quality — Determination of Total Nitrogen — Alkaline Potassium Persulfate Digestion UV Spectrophotometric Method"; GB/T 11893 "Water Quality — Determination of Total Phosphorus — Ammonium Molybdate Spectrophotometric Method".
- GB 18918—2002 "Discharge Standard of Pollutants for Municipal Wastewater Treatment Plant" and its amendment (implemented from 2026-03-01).
- Answers by relevant officials of the Ministry of Ecology and Environment and the Ministry of Housing and Urban-Rural Development to reporters' questions on the amendment to GB 18918—2002 (2026-01-07): four instantaneous values are added for COD/ammonia nitrogen/total nitrogen/total phosphorus; pH, color, and fecal coliform count are changed from daily average values to instantaneous values; exceeding any limit constitutes non-compliance.
- GB 13457—92 "Discharge Standard of Water Pollutants for Meat Processing Industry"; HJ 91.1—2019 "Technical Specification for Wastewater Monitoring"; GB 18597 "Standard for Pollution Control on the Storage of Hazardous Wastes" (waste liquid from online instruments).
- Reply from the Director's Mailbox of the Department of Ecology and Environment of Yunnan Province: Article 5.3.2 50 m of HJ 353—2019 refers to the distance between the station building and the water intake point, not the length of the sampling pipe.
- Reply from the Director's Mailbox of the Department of Ecology and Environment of Yunnan Province: after the implementation of the amendment to GB 18918, the upper range limit may be reasonably set according to the daily average limit in the pollutant discharge permit and the on-site discharge conditions.
- Reply from the Interactive Exchange of the Department of Ecology and Environment of Hebei Province: for manual monitoring replacement of invalid data under HJ 356—2019, no fewer than 4 times per day, and 1 times may replace 6 小时 automatic monitoring data.
- Reply from the Department of Ecology and Environment of Liaoning Province/Shenyang City: when the flow rate is zero, the online monitoring value is invalid data; the number of data participating in the statistics of a valid daily average value shall be no less than 75% of the number of data that should be obtained on that day.
- Jinyun County 2017 年 First Quarter Supervision Monitoring Report on Pollution Sources (including heavy metals) (wastewater): quality control samples passed while actual water sample comparisons failed in multiple places.
- Fengzhen City Wastewater Treatment Plant 2014 年 Third Quarter Wastewater Monitoring Report: comparison of actual water samples and quality control sample determination results for COD and ammonia nitrogen at the inlet/outlet.
- Decision on Ordering Correction of Illegal Acts of the Ecology and Environment Bureau of Chongqing Municipality (Yu Huan Gai [2026] No. 15, Chongqing Chenyuan Environmental Protection Technology Co., Ltd.).
- Decision on Not Imposing Administrative Penalty of the Ecology and Environment Bureau of Shangqiu City (Yu 1400 Huan Bu Fa Jue Zi [2025] No. 10, Ningling County Third Wastewater Treatment Plant).
- Administrative Penalty Decision of the Ecology and Environment Bureau of Wuzhou City (Wu Huan Fa Zi [2026] No. 34): correction of over-range data, flow-weighted calculation of valid daily average values, and determination under GB 13457—92.
- Guigang City Public Notice on Acceptance of the Feedback Opinions (Issue 16) from the Second Round of Ecological and Environmental Protection Inspection of the Autonomous Region: missing online data of township wastewater treatment plants, comparison error 58%, and administrative penalties.
- Typical Cases of Ecological and Environmental Law Enforcement (Batch 12) of the Ministry of Ecology and Environment (automatic monitoring field): the case of Jiangsu Xinyi Zhongke Food Co., Ltd. fabricating automatic monitoring data.
- Typical Cases of Ecological and Environmental Law Enforcement (Batch 9) of the Ministry of Ecology and Environment (automatic monitoring field): the case of Zunbao Iron Wire in Jinjiang, Fujian and Wenzhou, Zhejiang tampering with automatic wastewater monitoring data through dilution discharge and other means.
- Typical Cases of Investigation and Punishment of Fraud in Automatic Monitoring by Key Pollutant Discharging Units Published by the Ministry of Ecology and Environment (2021): the cases of Changxing, Huzhou, Zhejiang and Bicheng Printing and Dyeing in Wenzhou, Zhejiang.
- Typical Criminal Cases of Severely Punishing Fraud in Automatic Monitoring Data of Key Pollutant Discharging Units Jointly Released by the Supreme People's Procuratorate, the Ministry of Public Security, and the Ministry of Ecology and Environment (2023-10-19): the "COD removal agent" case of Xinmou Di in Changxing, Huzhou.
- Comparison Report of Automatic Monitoring Equipment for Water Pollution Sources of Nantong Gaomeng New Materials Co., Ltd. (2024-04-12): comparison of actual water samples and quality control sample assessment results for COD/ammonia nitrogen.
Note: The standard clauses and case data cited in this article all come from public documents and government public information. Among them, the difference in the comparison of actual water samples for total phosphorus between installation commissioning/acceptance (0.3 mg/L, ±0.06 mg/L) and operation (0.2 mg/L, ±0.04 mg/L) is checked item by item according to HJ 353 Table 3, HJ 354 Table 2, and HJ 355 Table 1; the quantified values of the relative error of online COD (UV method maximum 5.5%, UV for conventional water bodies about 3.5% versus about 1.5% for the dichromate method) come from public technical materials, have not been peer-reviewed, and are for directional reference only.
您提供的内容似乎不完整,缺少需要翻译的中文文本。请提供待翻译的中文内容,我将根据术语表为您翻译成地道的英文。