



 Multi-industry nationwide (petroleum refining/refining-chemical integration), in
 Pilot to engineering scale (single-plant wastewater at hundreds of m³/h; sour wa
Refinery Water System: The Hardest Stream Is Only a Tenth, Yet the Compliance Numbers Hide in the Denominator
More than 80% of the wastewater from the entire plant is oily wastewater, but more than 90% of the sulfide and ammonia nitrogen in the entire plant is concentrated in the acidic water that accounts for only 10% to 20%; while "water intake per ton of crude oil processed" has been reported from 1.2 to 0.24, and half of the several-fold difference lies in the denominator.
The water in a refinery is not one bucket of water; it is six buckets. Their names all sound like "wastewater," but in process terms each is a different thing: oily wastewater is the tailwater from product washing and oil-water separation; acidic water is water actively injected into the process to prevent corrosion and ammonium salt crystallization; spent caustic is the waste alkali liquor discharged from caustic washing and refining, which has its own identity in the "National Catalogue of Hazardous Wastes" and is also treated as a single stream in wastewater treatment design specifications. This article follows the destinations of these six water streams downward and peels apart, layer by layer, three things that are easily glossed over: why water volume and pollution load are inversely related; exactly how many differently scaled rulers exist before the same "purified water"; and how the assessment figure "water intake per ton of crude oil processed" has one knob in its denominator and one in its numerator that can each make you meet or fail the standard.
I. First, Know the Players: Six Water Streams in a Refinery
The "Technical Guideline for Accounting of Pollution Source Strength — Petroleum Refining Industry" divides refinery wastewater into six categories by nature and gives the proportion each accounts for of the plant's total wastewater volume. The most noteworthy thing about this classification is not how many categories it has, but that it writes "how much water a stream contains" and "how dirty a stream is" in two unrelated columns. Placing the two columns side by side reveals the true structure of the plant's water system.
| Wastewater Category | Approximate Share of Total Plant Wastewater Volume | Characteristic Pollutants |
|---|---|---|
| Oily Wastewater | 80% or more | Petroleum hydrocarbons, sulfides, phenols, COD |
| Sour Ammonia-Containing Wastewater | 10%~20% | Sulfides, ammonia nitrogen, cyanides, phenols |
| Saline Wastewater | 5% or less | Inorganic salts, free alkali, petroleum hydrocarbons, sulfides, phenols |
| Alkali-Containing Wastewater | Proportion not provided (related to the scale of alkali washing and refining) | Free alkali, naphthenic acids, sulfides, phenols |
| Desulfurization Wastewater | Proportion not provided | Sulfides, salinity |
| Other Process Wastewater and Domestic Sewage | Small amount | BOD₅, COD, Suspended Solids / SS (belongs to clean wastewater) |
Note: The main text of the original guideline does not provide the proportion of alkali-containing wastewater and desulfurization wastewater in the total plant wastewater volume. They are marked truthfully here and not filled in with estimates.
Among these six types of water, the first three streams are what truly underpin the name "refinery water system": oily wastewater, sulfur-containing and ammonia-containing sour water, and saline wastewater. They will appear repeatedly in the following text, because the treatment routes, equipment types, and even management criteria for these three streams are all different—mixing them in a single wastewater plant and assessing them against the same set of indicators is the first and most common mistake in refinery water management.
II. Water Volume and Load Inversion: The Largest Stream Is the Cleanest, the Smallest Stream Is the Most Difficult
The guideline provides a more detailed breakdown: oily wastewater is not homogeneous internally and must itself be divided into two stages:
| Segment | Share of Total Plant Oily Wastewater Volume | Petroleum Hydrocarbons | COD |
|---|---|---|---|
| Portion in Direct Contact with Oil Products (Oil-Water Separator Drainage, Oil Product Rinse Water, Pump Shaft Seal Cooling Water, Oil Tank Dewatering, Laboratory Oily Wastewater) | Approx. 20% | 500~1000 mg/L | Approx. 1000 mg/L |
| Portion in Indirect Contact (Floor Washdown Water, Oily Rainwater, Circulating Water Blowdown, etc.) | 70%~80% | Approx. 100~200 mg/L | Below 500 mg/L |
Substituting these two segments yourself yields a figure more informative than any single citation. Taking the medians of the two segments and weighting them simply: Petroleum Hydrocarbons 0.2×750 + 0.8×150 = 270 mg/L, COD 0.2×1000 + 0.8×400 = 520 mg/L. In other words, the actual concentration at the influent end of a refinery's "oily wastewater" is only about one-third that of the high-concentration stream.
Thus the first-level criterion holds: Oily wastewater is "the largest stream by volume," but not "the most difficult stream." What truly determines the fate of the whole plant's wastewater treatment facility is sour water—it accounts for only 10% to 20% of the plant's wastewater, yet carries more than 90% of the plant's total sulfide and ammonia nitrogen.
This "inversion" is the watershed in the design and operation of refinery wastewater systems. It means: if investment and attention are allocated by water volume, all the money will go to oily wastewater; but if allocated by pollution load, sour water is the real key. GB 50747—2012 Article 4.2.2 is written precisely according to the latter: ammonia-type sour water from units such as catalytic cracking, delayed coking, and hydrocracking "shall be treated by stripping," and it explicitly states that "the treated water can be reused as electric desalting wash water, catalytic rich gas washing water, or other process water" — in one sentence, both the treatment process and the reuse destination are fixed.
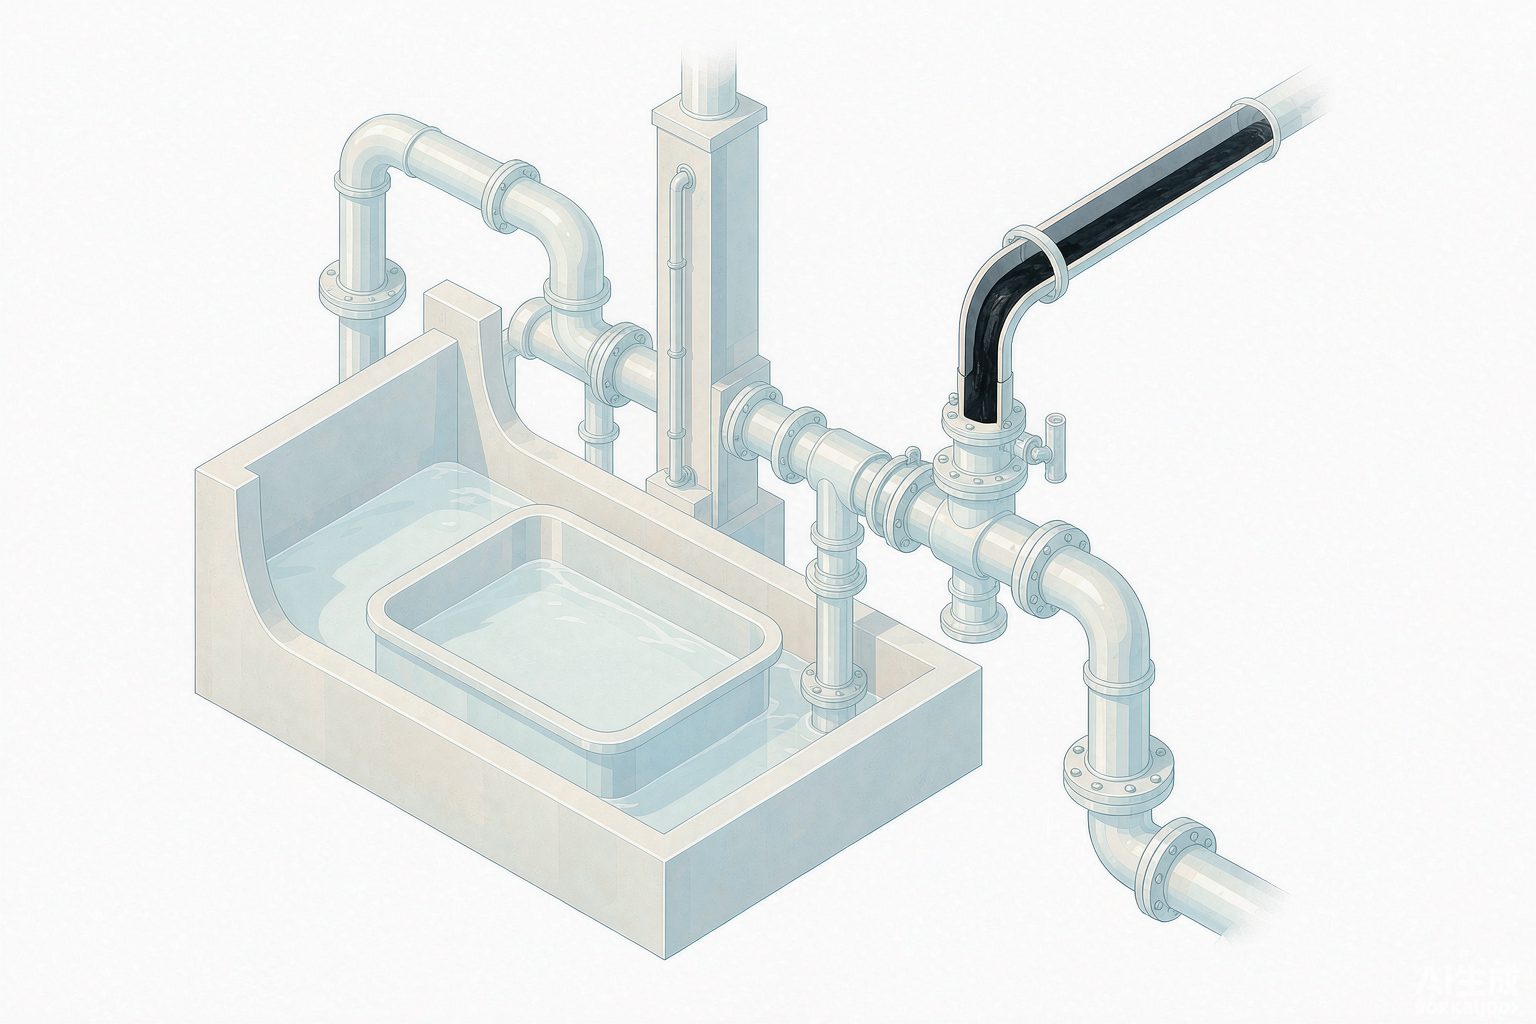
III. "Sour water" is not acidic: it is water actively injected into the process
The second criterion is even more counterintuitive. The industry habitually calls it "sour water," which makes people subconsciously assume it is water with a very low pH. But if we look at the source rather than the name, we find that it is actually water that refineries actively inject into the process to prevent corrosion and plugging — these injection points are:
| Source Unit | Water Generation Point | Why the Water Is There |
|---|---|---|
| Atmospheric and Vacuum Distillation | Overhead oil-gas separation, reflux drum water draw-off | Ammonia and water injection at the tower overhead to neutralize acidic substances and inhibit dew-point corrosion |
| Catalytic Cracking | Fractionator overhead reflux drum, absorption-stabilization system | Rich gas water wash, liquid hydrocarbon water wash, to remove hydrogen sulfide and cyanides |
| Delayed Coking | Coke drum overhead, fractionator overhead water draw-off | Water injection into the heater to prevent coking, flushing of the wax oil line |
| Hydroprocessing Units | Water injection ahead of the high-pressure air cooler, discharge from the high-pressure separator and stripper overhead | Injected water dissolves and washes away ammonium salts, preventing ammonium salt crystallization and plugging of heat exchangers |
The key lies in the last item. The water injected ahead of the high-pressure air cooler in hydroprocessing units dissolves ammonium salts such as NH₄HS and NH₄Cl. These salts are formed from nitrogen, sulfur, and chlorine in the feedstock under hydroprocessing conditions, and once they crystallize they plug the heat exchangers. So this stream is dealing with "ammonium" from start to finish—it is ammonia-containing water, and its pH tends to be alkaline rather than acidic. This is exactly where the name "sour water" is most misleading: its acidity comes from hydrogen sulfide, its alkalinity comes from ammonia, and which one prevails depends on their molar ratio, not on the name.
In the industry, the formal name for this stream of water is "sour water containing sulfur and ammonia," and the corresponding English term is sour water. The English term follows the same logic—it refers to "water carrying acid gas," not "water with low pH." From the design data, its concentration magnitude is also clearer: the original design treatment specifications of a certain refinery's sour water stripping unit were sulfide content ≤10000 mg/L, ammonia nitrogen content ≤5000 mg/L; however, as crude oil becomes heavier and lower in quality, the actual influent ammonia nitrogen has far exceeded the design value, which is also the direct reason why the steam consumption per unit mentioned later cannot be reduced.
IV. The stripping tower is designed for "ammonia," not "sulfur"
The unit that treats sour water is the stripping tower. Here there is a physical fact that determines the size of the entire tower, and English engineering technical materials state it more directly than Chinese materials: the distribution coefficient of hydrogen sulfide is extremely high (on the order of 200), and it will be stripped out near one theoretical plate; while the apparent distribution coefficient of ammonia is only on the order of 4, requiring 2~4 theoretical plates for removal. Therefore, what determines tower height, plate number, and steam usage has always been ammonia, not sulfur.
This explains why the difference among the three mainstream processes is not "whether desulfurization can be achieved," but "how ammonia is handled":
| Process | Column Top Pressure | Temperature Characteristics | Specific Steam Consumption (kg/t sour water) |
|---|---|---|---|
| Single-column low-pressure total withdrawal (overhead gas not condensed and refluxed) | 0.12~0.15 MPa | Column top 104~114℃ | 100~115 (overhead gas to flare for incineration) |
| Single-column low-pressure total withdrawal (overhead gas condensed and refluxed) | 0.12~0.15 MPa | Column top 104~114℃ | 130~180 (overhead gas can be sent to sulfur recovery) |
| Single-column pressurized side-draw ammonia | 0.5~0.6 MPa | Cold feed 35~40℃, hot feed 140~150℃, column bottom 160~165℃ | 150~200 (when steam temperature >180℃) |
| Two-column pressurized | Relatively high, H₂S and NH₃ recovered separately | — | — |
Note: For single-column low-pressure total withdrawal, when the column top pressure is taken as 0.12~0.15 MPa, the solubility of ammonia in water is required to be nearly zero, and the column top temperature must be above 82℃; in engineering practice, 104~114℃ is often adopted. The side-draw gas of side-draw ammonia contains about 15%~20% ammonia, and the side-draw ratio is about 7%~10%. The adoption rate of two-column pressurized processes is declining due to the storage and transportation risks of recovered liquid ammonia.
Here we encounter the first case in this round of "one and the same number having four values." For the same question—"how much steam does it take to strip one ton of sour water"—public sources give: single-tower low-pressure without reflux 100~115 kg/t, with reflux 130~180 kg/t, single-tower pressurized side-draw ammonia 150~200 kg/t, while a certain refinery unit's actual steam consumption is 253 kg/t, planned to be reduced to 225 kg/t, design value 213 kg/t. These four numbers are not contradictory—they correspond to different processes, different influent and effluent concentrations, and different destinations for the overhead gas. But citing them as if they were the same number will lead to completely wrong energy consumption conclusions.
That refinery also offered a statement worth noting: steam consumption accounts for 91.2% of the unit's main energy consumption. In other words, the energy account of a sour water stripping unit is essentially its steam account. So the next question—"exactly how clean should the stripping be"—is directly equivalent to "how much steam is burned per year."
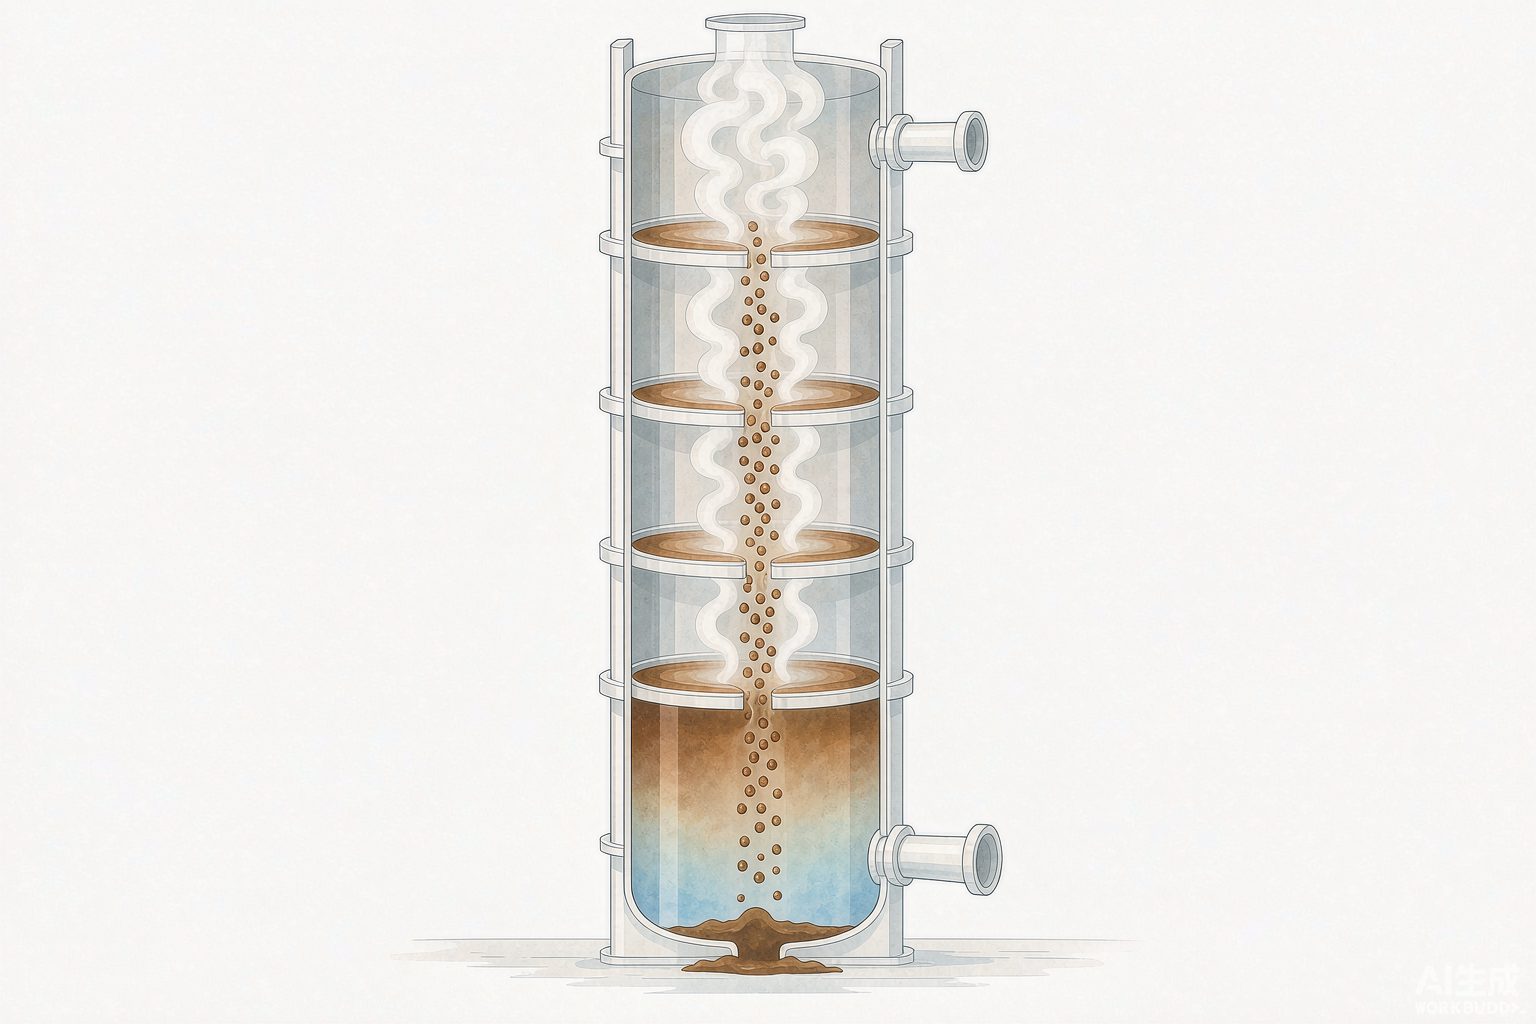
V. There are four rulers before the purified water, and the strictest one is not what reuse requires
The water produced by stripping is called "purified water." It has several destinations: injection water for the electro-desalting unit, wash water for catalytic rich gas, air-cooler injection water for hydrogenation units, or discharge to the wastewater treatment plant. The problem is that each destination has different water quality requirements, and the set of numbers most frequently cited in public sources happens to be the strictest set.
| Destination / Compliance Point | H₂S | Ammonia / Ammonia Nitrogen | Other Key Parameters |
|---|---|---|---|
| Environmental compliance (general requirements for stripped water) | ≤20 | ≤50 | — |
| Water injection reuse for hydrocracking unit | — | ≤300 essentially does not affect water injection performance | — |
| Electric desalting water injection, catalytic rich gas washing (GB 50747 Article 4.2.2) | Implemented as reusable; the standard gives no quantitative value | — | Excessive alkalinity causes severe crude oil emulsification; excessive sodium ions cause poisoning of hydrogenation catalysts |
| Make-up water for circulating cooling water (moderately treated up-to-standard discharged wastewater) | — | ≤10 (as NH₃-N) | COD ≤60, petroleum ≤2, Suspended Solids / SS ≤10 |
| Discharge outlet (GB 31570—2015 Table 1, direct discharge) | Sulfide 1.0 | Ammonia Nitrogen 8.0 | COD 60, petroleum 5.0, volatile phenols 0.5 |
Looking at the second row together with the first, a concept that is repeatedly discussed in the industry but rarely written about in depth emerges: over-stripping. The relevant patents and journal literature state it plainly—as reuse water for a hydrocracking unit, purified water with NH₃ ≤300 mg/L essentially does not affect performance, whereas stripping the water to NH₃≤50 mg/L before reuse amounts to burning a large amount of extra steam for a limit that is never needed. Since steam accounts for more than ninety percent of the unit's energy consumption, this "unneeded margin" is itself a considerable energy cost.
To address this, the industry has proposed an improved scheme with "liquid-phase side draw": two non-alkaline reuse water lines are arranged from top to bottom in the lower part of the stripper. The upper line has relatively higher NH₃ and H₂S content and is used as water for hydrocracking or catalytic cracking units; the lower line has lower content and is used as water for atmospheric and vacuum distillation and hydrotreating units—different units are given different stripping depths, rather than the entire plant uniformly stripping to the strictest line.
What stripping cannot remove: fixed ammonium
The second issue is even tougher. In the sour water from units such as catalytic cracking and delayed coking, in addition to free ammonia, a portion of ammonia nitrogen exists in the form of fixed ammonium—that is, ammonium salts formed by NH₄⁺ combined with strong acid radicals such as SO₄²⁻, S₂O₃²⁻, HSO₃⁻, and Cl⁻. Public literature gives the magnitude: 50%~80% of the total ammonia contained in the purified water exists in the form of fixed ammonium; when the total ammonia in the purified water is 50~400 mg/L, the fixed ammonium therein is 30~300 mg/L.This portion of ammonia is very difficult to remove by conventional stripping.
To remove it, the common practice is to add sodium hydroxide to the stripper. However, adding alkali brings two new problems, and in completely opposite directions:
| Introduced Component | Reuse Point Where Problems Occur | Consequence |
|---|---|---|
| Alkali (OH⁻/residual alkalinity) | Desalter wash water injection | Excessively high alkali concentration causes severe crude oil emulsification and disrupts oil-water separation in the desalter |
| Sodium ion (Na⁺) | Hydrotreating unit wash water injection | Excessively high sodium ion concentration causes poisoning of hydrotreating catalysts |
The reuse rate ledger can also be cross-checked along the way. The Technical Guidelines for Synergistic Pollution Reduction and Carbon Reduction in the Petrochemical Industry (Preparation Notes) states that sour wastewater after stripping is used as desalter wash water injection, etc., and the reuse rate should be no less than 65%; industry papers mention that advanced enterprises can achieve a stripped purified water reuse rate of around 85%; one refining and chemical company's practice is to cascade the sour wastewater from the top of the catalytic cracking fractionator as wash water injection for rich gas washing, and to cascade the sour wastewater from non-hydrotreating units as wash water injection for delayed coking rich gas washing, reducing softened water consumption by nearly 30 t/h; another enterprise explicitly states that "wash water injection in hydrogen-contact units achieves 50% use of desulfurized purified water." The four figures 65%, 85%, cascade, and 50% actually describe four cross-sections of the same matter—the denominators are respectively the plant-wide sour water generation, the stripped purified water volume, and the wash water injection volume of a certain unit.
VI. Alkali Sludge: It Is Hazardous Waste in the Catalog, but a Water Stream in Design Specifications
The third-tier criterion comes from another line at the refinery: caustic washing and refining of oil products. The caustic solution is recycled until NaOH falls below a certain value and is then discharged; the discharged spent caustic liquor is commonly known as "refinery caustic sludge." Its identity in the "National Catalogue of Hazardous Wastes (2021 年 Edition)" is clear:
| Waste Category | Industry Source | Waste Code | Hazardous Waste | Hazardous Characteristics |
|---|---|---|---|---|
| HW35 Waste Alkali | Refined Petroleum Product Manufacturing | 251-015-35 | Waste alkali liquor and alkali residue generated during petroleum refining | C, T (Corrosivity, Toxicity) |
| HW35 Waste Alkali | Non-specific Industry | 900-352-35 | Waste alkali liquor generated from alkali cleaning | C, T |
This table explains a point that is often misunderstood in practice: the same type of waste has two codes in this list, and the difference lies in the "generating industry." Alkali residue from refineries must fall under the code with an industry source, 251-015-35 (hazardous characteristics C, T); whereas "waste alkali liquor generated from alkali cleaning" is another code, 900-352-35. Article 5, Item (3) of the list already specifies the code structure: the first 3 digits are the generating industry code, digits 4~6 are the sequence code, and digits 7~8 are the category code. Before selecting a code, check the industry first, then the waste description—this is the first rule of hazardous waste codes.
What makes spent caustic hardest to handle is its composite identity: publicly available literature points out that refinery spent caustic is a high-concentration, toxic, refractory special organic waste liquid, dark in color, foul-smelling, and highly corrosive, and its generation of COD, sulfides, phenols, and color accounts for more than 30% of the total pollution load of the entire petrochemical refining system—a single stream of "water" carrying one-third of the pollution load generated by the whole system.
Meanwhile, Article 4.2.6 of the Design Code for Wastewater Treatment in Petrochemical Industry states: "Spent caustic wastewater may be desulfurized by methods such as wet oxidation." The same liquid stream is managed as hazardous waste under the solid waste catalog, yet designed as wastewater under the wastewater treatment design code. This is not two documents contradicting each other; it genuinely is two things at once—regulations characterize it by "attributes and destination," while design codes describe it by "treatment unit." Any project that receives spent caustic must walk both lines separately.
Wet Air Oxidation: Two Temperature Ranges, Two Purposes
| Item | Mild Wet Air Oxidation | High-Temperature Wet Air Oxidation |
|---|---|---|
| Reaction Temperature | 100~200℃ | 270℃ |
| Operating Pressure | 0.2~3.5 MPa | 9.0 MPa |
| Residence Time | — | Not less than 120 min |
| Sulfide | S²⁻ oxidized to SO₄²⁻, oxidation efficiency up to 100% | S²⁻ not detected in effluent |
| Phenols | Minimize destruction to facilitate subsequent acidification recovery of crude phenols or naphthenic acids | Removal rate 99.4% |
| COD | Partial removal | Removal rate 83.5% |
| Biodegradability | — | B/C increased from 0.32 to 0.69 |
| Ammonia Nitrogen | — | Poor removal performance; requires separate consideration before entering the wastewater treatment plant |
The difference between the two grades lies not in "which is better" but in different objectives: the goal of mild oxidation is deodorization while preserving valuable materials (phenols, naphthenic acids), which are then mixed with the refinery's main system at a volume ratio of approximately 1∶100 before entering biological treatment; the goal of high-temperature high-pressure oxidation is to break down refractory organics and raise biodegradability from 0.32 to 0.69, at the cost of a 9.0 MPa pressure rating and a facility investment on the order of 650 万 yuan (a certain refining and chemical company 2003 年 built China's first wet air oxidation unit for caustic sludge with a treatment capacity of only 1 m³/h, with an investment of 650 万 yuan; severe scaling and plugging of the system occurred in the early stage of commissioning, and after troubleshooting, the sulfide removal rate stabilized above 99.9%).
VII. "Water Intake per Ton of Crude Oil Processed": One Knob Each in the Denominator and the Numerator
Now let us turn to the assessment side. One of the most frequently cited figures in refinery water management is "water intake per ton of crude (feed) oil processed," in m³/t. Its definition in GB/T 18916.3—2022 is written very briefly, but there are two places that are easy to overlook.
Knob One: The Denominator Includes "Purchased Feedstock Directly Entering Secondary Processing," and Secondary Processing Is Not Counted Twice
The standard's definition of the denominator is: the amount of crude (feed) oil processed is calculated as the total processing volume of crude (feed) oil that undergoes primary processing or directly enters secondary processing. This sentence does two things: first, it counts purchased feedstock such as wax oil, residue oil, and condensate that "directly enters secondary processing" into the denominator; second, it does not count the same batch of oil twice when it undergoes secondary processing within the plant—wax oil from atmospheric and vacuum distillation entering catalytic cracking is still counted in that one atmospheric and vacuum distillation pass.
The deviation caused by these two rules can be calculated on your own. Suppose a plant processes 800 万 t/a of crude oil in primary processing, purchases an additional 200 万 t/a of wax oil and residue oil that directly enters secondary processing, and has an annual water intake of 480 万 m³: calculated with the standard denominator of 1000 万 t, the water intake is 0.48 m³/t; if the "crude oil processing volume of 800 万 t" is mistakenly used as the denominator, the result is 0.60 m³/t. 0.60 happens to be the quota ceiling for existing enterprises given in GB/T 18916.3—2022—with the same water intake and the same plant, simply because of whether those 200 万 t of purchased feedstock are counted in the denominator, one figure falls within the limit while the other just grazes the line.
Knob Two: The Numerator Includes Purchased Steam and Hot Water
Even more counterintuitive is the numerator. The scope of "water intake" in the standard explicitly includes the water volume of "other water or water products (such as steam, hot water, geothermal water, etc.) purchased by the enterprise from the market." That is to say, steam purchased by the refinery from outside must be converted into water volume and counted in water intake. Yet the "fresh water intake" on an enterprise's routine reports usually covers only the three items of tap water, surface water, and groundwater, and does not include purchased steam, nor unconventional water sources such as reclaimed water, desalinated seawater, and rainwater.
Thus comes the fifth "denominator-type" hit of this round: the "fresh water per ton of oil" reported by the enterprise and the "water intake per ton of crude oil processed" defined by the standard are inherently different in the numerator and cannot be directly compared against the quota. One refining and chemical company's publicly reported result is "water intake per ton of oil dropped to 0.26 tons" from 2024 年 tons; for the same enterprise, 2022 年 0.31, 2023 年 0.295—during the same period, the company's urban reclaimed water consumption already accounted for more than 60% of the plant's total water consumption. 0.26 t/t is on a fresh water basis; if the urban reclaimed water accounting for more than sixty percent were also counted in water intake, this figure would rise significantly. This is not the enterprise falsifying data, but two sets of accounting bases colliding on the same term.
| Document / Entity | Basis | Value |
|---|---|---|
| NDRC "Water Intake Quota for Petroleum Refining" (2005) | Fuel-type refinery | ≤1.2 |
| Same as above | Fuel-lubricant-type refinery | ≤1.5 |
| GB/T 18916.3—2012 (cited in MIIT "Water Efficiency Guide for Key Industrial Sectors") | Limit value / access value | 0.75/0.60 |
| GB/T 18916.3—2022 | Existing enterprises / new and expansion projects / advanced enterprises | 0.60/0.41/0.31 |
| MIIT "Water Efficiency Guide for Key Industrial Sectors" (industry survey) | Average value / advanced value | 0.70/0.50 |
| Green Factory Evaluation Requirements for the Petroleum Refining Industry | Baseline / encouraged | 0.75/0.60 |
| Public data of a certain refining and chemical company (freshwater basis) | Water intake per 2024 年 tons of oil | 0.26 (t/t) |
Note: The last row and the third-to-last row share the same denominator but differ in the basis of the numerator, so they cannot be directly compared side by side with the quotas in the first three rows. The numerator of the corporate data is the fresh water intake, excluding unconventional water sources such as municipal reclaimed water.
VIII. A division is hidden in the emission standards: baseline wastewater discharge volume
There is a second matter on the assessment side, and it is harder than water intake because it directly determines compliance. In the limit value tables of GB 31570—2015, besides concentration, there is another column called "baseline wastewater discharge volume per unit of crude (feed) oil processed": Table 1 (conventional limits) is 0.5 m³/t crude oil, and Table 2 (special emission limits) is 0.4 m³/t crude oil. The conversion formula given in Article 4.4 of the standard is:
ρ基 = Q总 ÷ (ΣY·Q基) × ρ实
Where Q总 is the total wastewater discharge volume (m³), Y is the crude (feed) oil processing volume (t), Q基 is the baseline wastewater discharge volume (m³/t), and ρ实 is the measured concentration (mg/L). The standard also specifies a boundary condition: if the ratio of Q总 to ΣY·Q基 is less than 1, the measured concentration shall be used as the basis for determination.
Substituting this rule once makes clear what it blocks:
| Scenario | Measured COD | Actual Discharge Volume | Ratio Qtotal/(Y·Qbaseline) | Concentration for Determination ρbaseline | Conclusion |
|---|---|---|---|---|---|
| Discharge volume within baseline | 55 mg/L | 0.40 m³/t | 0.8 < 1 | 55 mg/L (use measured value directly) | Compliant |
| Discharge volume exceeds baseline | 55 mg/L | 0.75 m³/t | 1.5 | 1.5 × 55 = 82.5 mg/L | Exceeds Standard |
The measured concentrations in the two rows are identical, yet the conclusions are completely opposite. This is how "dilution discharge" is shut down in this standard: the extra water you discharge will proportionally amplify your own measured concentration back up. Many on-site technical personnel are familiar with concentration limits but do not know that once the discharge volume exceeds the baseline, it will be converted in this way, leading to the situation where "online data always meets the standard, yet it is still judged as exceeding the standard."
Two more details are worth noting separately. First, not every item has a value in the indirect discharge column: in Table 1 of GB 31570, indirect discharge limits are given for petroleum hydrocarbons, sulfides, volatile phenols, total vanadium, benzene series, total cyanide, etc., while the indirect discharge columns for Suspended Solids / SS, Chemical Oxygen Demand / COD, BOD₅, ammonia nitrogen, Total Nitrogen / TN, Total Phosphorus / TP, and total organic carbon are left blank; the table note states that wastewater entering the wastewater treatment plant of an Industrial Park shall comply with the indirect discharge limits, and for pollutant items without specified limits, the enterprise and the park wastewater treatment plant shall agree on relevant standards based on the treatment capacity of the plant and file them with the local competent environmental protection department. In other words, the rules for these items are not written in the national standard but in the filing document between the enterprise and the park wastewater treatment plant.
Second, when two sets of standards apply simultaneously, the stricter one shall be implemented, and the benchmark discharge volume shall be weighted separately for each product. The original text of the standard: when the production facilities of an enterprise simultaneously produce two or more products, different emission control requirements or national pollutant emission standards for different industries may apply, and wastewater is treated and discharged in a mixed manner, the strictest concentration limits in the emission standards shall be implemented, and the benchmark discharge volume emission concentration shall be converted according to the formula. For an integrated refining and chemical enterprise, this means that once the wastewater from the refining section and the chemical section is mixed, the concentration shall follow the stricter side.
IX. Putting the three water streams back into one table
The completion environmental protection acceptance monitoring report of a refining and chemical enterprise's refining quality upgrading project provides a rare set of measured records of "three water streams in three separate systems". The report gives the wastewater volume of this project, not the total plant volume, but the division of the three water streams is clear:
| Wastewater Category | Discharge Volume of This Project | Treatment Route and Destination | Design Capacity |
|---|---|---|---|
| Sour Water | 18.2 m³/h | Relying on 1# and 2# sour water stripping units, single-column low-pressure full stripping; the ammonia-rich gas withdrawn from the side stream is subjected to partial condensation, purification, and compression to obtain liquid ammonia as a by-product; the acid gas from the top of the column is used as feedstock for sulfur recovery; the purified water is reused in the unit, and the portion not reused enters the oily wastewater series for advanced treatment | 80 t/h each |
| Oily Wastewater | 10 m³/h | Oily wastewater treatment plant: pretreatment + A/O aeration tank + Biological Aerated Filter (BAF), then advanced treatment by dual-membrane process (Ultrafiltration + Reverse Osmosis) and reused as make-up water for the circulating water system | 400 m³/h |
| Saline Wastewater | 37.86 m³/h | After pretreatment by three-stage electric desalting facilities, enters the saline wastewater treatment plant (pretreatment + surface aeration tank + blower aeration tank + immobilized microorganisms), then enters the advanced treatment unit (DNF + Ozonation + Activated Carbon) before discharge | 300 m³/h; advanced treatment 550 m³/h |
There are two easily overlooked points in this table. First, the design capacity of sour water (80 t/h×2) is far greater than the discharge volume of 18.2 m³/h from this project—the stripping units are designed based on the long-term fluctuations of sour water across the entire plant and the startup/shutdown of upstream units, not sized according to the actual water volume during a certain period; estimating unit capacity using the latter water volume would result in severe underestimation. Second, the design capacity of oily wastewater is 400 m³/h while this project only accounts for 10 m³/h, which likewise indicates that the capacity of the wastewater plant is calculated based on the three lines of the entire plant combined, and the discharge volume of a single project is only one component of it.
Electric Desalting: The Source of Saline Wastewater, Four Sets of Figures Coexist
The main source of saline wastewater is electric desalting effluent. Inorganic salts in crude oil (NaCl, MgCl₂, CaCl₂, etc.) need to be washed out with water before atmospheric and vacuum distillation. The common practice is to inject fresh water and add demulsifier, causing fine water droplets to coalesce under an electric field and separate by gravity settling. Regarding this matter, "how much water to inject" has four sets of figures in publicly available information:
| Source | Whether it refers to water injection volume or discharge volume | Value |
|---|---|---|
| Preparation notes for discharge standards | Injection of fresh water | Approximately 5% |
| Preparation notes for discharge standards | Wastewater volume generated by electric desalting | 3%~5% / ton of oil |
| Patent literature (classified control and staged treatment of refinery wastewater) | Electric desalting discharge volume | Approximately 5%~7% of crude oil throughput |
| Commercial technical documentation | Water injection ratio (supplemented at the secondary stage) | 5%~12% (secondary stage supplemented 2%~5%) |
The four sets of figures do not contradict one another: the water injection volume is greater than the discharge volume (part of the water is carried away with the oil), and the water injection rates also differ between the primary and tertiary processes. What truly needs to be remembered are the two characteristics of electric desalting discharge water—high temperature (above 80℃) and high salinity. The total salt content level given in the preparation notes is "generally higher than 1000 mg/L, mostly between 2000~5000 mg/L, and sometimes even reaching above 10000 mg/L", while also containing relatively high emulsified oil and a certain degree of poor biodegradability. Conventionally, this type of water enters the saline wastewater stream for separate treatment; if mixed into the oily wastewater stream, it will simultaneously impact the salinity and oil load of the biological treatment stage.
As a verifiable reference for process performance, public tests have provided the optimized conditions and results of electric desalting: the optimized conditions for a certain pipeline crude oil are an operating temperature of 135~140℃, a water injection rate of 6%~7%, an AC/DC composite electric field strength of 900~1100 V/cm, and a demulsifier injection rate of 15~20 μg/g; under these conditions, after three-stage pretreatment, the salt content of the desalted crude oil decreased from an average of 5.90 mg/L to 2.52 mg/L, and the oil content in the electric desalting effluent water decreased from an average of 122.1 mg/L to 83.74 mg/L. The commonly accepted control indicators in the industry are desalted crude oil salt content <3 mg/L and water content <0.3%. Note that the two figures here belong to two different objects — 2.52 mg/L refers to the oil, and 83.74 mg/L refers to the water; the former is product quality, while the latter is the influent to the wastewater treatment plant.
Finally, look at a set of real discharge outlet data
| Enterprise and Outfall | Applicable Limit | COD | Ammonia Nitrogen | Petroleum | Suspended Solids |
|---|---|---|---|---|---|
| Main outfall of a certain refining and chemical company (refining section) | GB 31570 direct discharge limits | 32 / 60 | 0.20 / 8 | 2.1 / 5.0 | 9 / 70 |
| Zhujiang outfall of a certain petrochemical company (refining) | GB 31570 Table 2 special emission limits | 31 / 60 | 0.22 / 8 | 0.19 / 5 | 13 / 70 |
| Main outfall of a certain petrochemical company | GB 31570 direct discharge standard | 31 / 60 | 0.97 / 8.0 | 0.997 / 5.0 | 17 / 70 |
Note: The format is "measured value / standard limit", with units in mg/L. The petroleum ratios to the limit in the three rows are 42%, 3.8%, and 20%, respectively, making petroleum the item with the highest ratio to the limit among the three rows—the engineering implication of this is that the removal of petroleum by conventional biological treatment is not unconditional, and it is the item that refinery wastewater treatment plants most need to keep under close watch.
These three lines of data are placed at the end of this article to give all the preceding discussions of calculation bases a landing point: every number in the standard must ultimately land on a measured value at a discharge outlet; and before it lands, it must first go through three conversions: denominator, numerator, and baseline discharge volume. All three conversions take place on paper, not in the water—but they can equally determine whether an enterprise meets the standard or not.
X. Key Parameter Points
| # | Key Point | Value / Criterion |
|---|---|---|
| 1 | The true main players among the six water streams | Oily wastewater accounts for more than 80% of the plant's total wastewater; sour water accounts for 10%~20% but carries more than 90% of the plant's sulfides and ammonia nitrogen |
| 2 | Measured weighted values for the two stages of oily wastewater | Petroleum substances 0.2×750+0.8×150 ≈ 270 mg/L; COD ≈ 520 mg/L |
| 3 | Order of magnitude of sour water influent concentrations | Design sulfide ≤10000 mg/L, ammonia nitrogen ≤5000 mg/L; inferior crude oil can push these far beyond design values |
| 4 | What determines the size of the stripper | H₂S distribution coefficient about 200 (about one theoretical stage), NH₃ apparent coefficient about 4 (requires 2~4 theoretical stages)—design based on ammonia |
| 5 | Four sets of figures for specific steam consumption | 100~115 / 130~180 / 150~200 kg/t; one plant's actual 253, target 225, design 213 |
| 6 | Four yardsticks for purified water | Environmental compliance: H₂S≤20, NH₃≤50; hydrocracking reuse: NH₃≤300; cooling water makeup: COD≤60, NH₃-N≤10 |
| 7 | Fixed ammonium fraction | 50%~80% of total ammonia in purified water is fixed ammonium, difficult to remove by conventional stripping; alkaline removal introduces alkali and sodium |
| 8 | Regulatory status of spent caustic | HW35, refined petroleum product manufacturing source code 251-015-35 (C, T); accounts for more than 30% of the pollution load generated in the whole system |
| 9 | Denominator and numerator of the water intake quota | The denominator includes purchased materials fed directly into secondary processing and is not double-counted; the numerator includes purchased steam/hot water |
| 10 | Baseline discharge volume and conversion | Table 1 is 0.5 m³/t, Table 2 is 0.4 m³/t; ρbaseline=Qtotal/(ΣY·Qbaseline)×ρactual; when the ratio <1, use the measured concentration |
References
- Ministry of Ecology and Environment. Emission Standard of Pollutants for Petroleum Refining Industry: GB 31570—2015 (including 2024 年 Amendment Sheet). Issued on 2015-04-16, implemented on 2015-07-01; the Amendment Sheet was issued by the Ministry of Ecology and Environment in Announcement No. 17 of 2024 年.
- Ministry of Ecology and Environment, State Administration for Market Regulation. Announcement on the Issuance of Amendment Sheets to Three National Pollutant Emission Standards Including the Emission Standard of Pollutants for Petroleum Refining Industry. 2024-05-11.
- Ministry of Ecology and Environment. Interpretation | Amendment Sheets to Three National Pollutant Emission Standards Including the Emission Standard of Pollutants for Petroleum Refining Industry. 2024-06-12.
- Ministry of Ecology and Environment. Preparation Notes for the Technical Guideline for Accounting of Pollution Source Strength — Petroleum Refining Industry (Draft for Comments). 2018-09.
- Ministry of Ecology and Environment. Preparation Notes for the Technical Specification for Application and Issuance of Pollutant Discharge Permits — Petrochemical Industry (Draft for Comments). 2017-05.
- Ministry of Ecology and Environment. Preparation Notes for the Water Pollutant Emission Standard for Petroleum Refining Industry (Draft for Comments) (electric desalting water injection volume, wastewater volume and total salt content levels).
- Ministry of Housing and Urban-Rural Development. Code for Design of Petrochemical Wastewater Treatment: GB 50747—2012.
- State Administration for Market Regulation, Standardization Administration of China. Norm of Water Intake — Part 3: Petroleum Refining: GB/T 18916.3—2022.
- National Development and Reform Commission. Norm of Water Intake for Petroleum Refining. 2005-07-11.
- Ministry of Industry and Information Technology. Guidelines for Water Use Efficiency in Key Industrial Sectors (Table 12: Water Intake Indicators per Unit Product for Petrochemical and Chemical Industries).
- Evaluation Requirements for Green Factories in the Petroleum Refining Industry (public text, including water resource and waste resource utilization indicators).
- State Environmental Protection Administration. Cleaner Production Standard — Petroleum Refining Industry: HJ/T 125—2003 (unit discharge volume of wastewater, unit discharge volume of pollutants and calculation methods).
- Ministry of Ecology and Environment, State Administration for Market Regulation. National Catalogue of Hazardous Wastes (2021 年 Edition). Issued on 2020-11-27, effective from 2021-01-01.
- Chenzhou Municipal Ecology and Environment Bureau. Typical Cases of Ecological and Environmental Protection Law Enforcement in the "Sword" Action (Third Batch): Case of Illegal Dumping of Waste Alkali Liquor Polluting the Environment. 2023-08.
- Deng Degang, Zhou Tong, Qin Lijiao. Experimental Study on Treatment of Refining Waste Alkali Residue by High-Temperature Wet Air Oxidation Process. Refining Technology and Engineering, 2015, 45(1).
- Liu Chengjun, Deng Jianyong, Wen Shichang, et al. Discussion on Methods for Improving Reuse Water Quality and Reducing Energy Consumption of Sour Water Stripping Units. Petroleum and Natural Gas Chemical Industry, 2015, 44(6).
- Petrochemical Sour Wastewater Stripping and Purification System and Method (technical literature, including single-tower low-pressure stripping steam unit consumption, fixed ammonium proportion and consequences of alkali addition). Wastewater Treatment Engineering Network, 2018-04-16.
- Classification Control and Graded Treatment Method for Refinery Wastewater: CN 102452750 A (sour wastewater volume variation trend, electric desalting drainage proportion, purified water reuse proportion).
- Resource Utilization Method for Stripped and Purified Water from Petroleum Refining: CN 119018964 A (quality-based reuse of high-phenol/low-phenol stripped purified water and water quality control requirements).
- Treatment Method for High-Concentration Waste Alkali Residue Wastewater: CN 101693579 B (composition of refinery waste alkali residue, hazardous waste code and wet oxidation route).
- Operation Study of Wet Air Oxidation Treatment Unit for Refinery Waste Alkali Residue (investment and operation troubleshooting of a 1 m³/h unit in a certain refining and chemical company).
- Optimization of Operating Conditions of Crude Oil Electric Desalting Unit. Contemporary Chemical Industry, 2015, 44(12).
- Study on Dehydration Effect of Two Crude Oil Electric Desalting Processes (dissertation; salt content and water content after desalting and Sinopec control indicators).
- Study on Treatment and Reuse Process of Refinery Wastewater in Desert Regions of Africa (dissertation; sour water stripping revamping and purified water reuse accounts of overseas refineries).
- Brief Analysis of Sour Water Stripping Process Selection (three mainstream flowsheets and purified water quality standards).
- Discussion on Steam Consumption Reduction of Sour Water Stripping Units (steam energy consumption of a certain plant 253 kg/t, design value 213 kg/t, steam accounting for 91.2% of unit energy consumption).
- Sour Water Stripping (process entry: pressure and temperature parameters of single-tower pressurized side-draw ammonia removal and single-tower low-pressure stripping).
- Sour Water Stripper — Engineering Fundamentals (apparent distribution coefficients of H₂S and NH₃, steam ratio and number of trays).
- Study on Wastewater Reuse Technology in Petrochemical Enterprises (water quality control indicators for circulating cooling water make-up, reuse rate of stripped purified water, cascade use accounts).
- Technical Guidelines for Synergistic Reduction of Pollution and Carbon Emissions in the Petrochemical Industry (Preparation Notes). China Petroleum and Chemical Industry Federation.
- Completion Environmental Protection Acceptance Monitoring Report for the Refining Quality Upgrade and Revamping Project of Sinopec (Tianjin) Petrochemical Co., Ltd.
- Sinopec. Shijiazhuang Refining & Chemical Makes Water Efficiency "Come Alive" to Empower Green Development (2024 年 water reuse rate 99.29%, water intake per ton of oil 0.26 t/t, urban reclaimed water proportion above 60%); Shijiazhuang Refining & Chemical Listed as a Water Efficiency "Leader" Benchmark Enterprise for Two Consecutive Years; Hebei Daily "Three Consecutive Years of Water Efficiency Leadership Empowering Green Development of Enterprises".
- Sinopec News Network. Zhenhai Refining & Chemical: Technology Empowers Green Transformation, Winning the Industry Water Efficiency Benchmark for Five Consecutive Years. 2025-12.
- Qingdao Municipal Bureau of Industry and Information Technology. Experience in Water Conservation of Industrial Enterprises No. 3: Water Conservation Experience of Sinopec Qingdao Petrochemical Co., Ltd. 2023-05.
- Xianyang Municipal Ecology and Environment Bureau, Qingyang Municipal Ecology and Environment Bureau, People's Government of Jiang'an District of Wuhan Municipality, Department of Ecology and Environment of Guangdong Province: Public Tables of Supervisory Monitoring Results of Wastewater from Petroleum Refining Enterprises.
All data in this article are taken from public standards, government public documents, journal papers and publicly disclosed corporate reports, with sources indicated item by item; entries involving commercial technical materials have explicitly stated their nature in the main text. The self-calculated results in this article (weighted concentrations, benchmark discharge volume conversion, denominator deviation) are all provided with calculation formulas and can be verified. Where enterprise names are involved, the publicly disclosed statements of the enterprises concerned shall prevail.
您提供的内容似乎不完整,缺少需要翻译的中文文本。请提供待翻译的中文内容,我将根据术语表为您翻译成地道的英文。