



 Publicly available cases across multiple industries nationwide (municipal wastew
 Engineering (single pump 5 to 20,000 m³/h; pump stations and wastewater treatmen
Industrial Water Treatment Pumps: The Point on the Nameplate Is the Design Point, Not the Operating Point
Pumps rarely die from manufacturing quality. They die from four numbers—selection margin, net positive suction head available, cut amount, and solids content. And each of these four numbers has more than two sets of definitions.
In a wastewater treatment plant treating 100,000 tons per day, the installed power of pumps typically accounts for 15%~25% of the plant's total electricity consumption; in a wet flue gas desulfurization power plant, the motor power of slurry circulation pumps can match that of a small generating unit. These pumps have all been calculated on drawings, and selection calculation sheets exist, but what truly determines their service life and electricity costs is often not that calculation sheet, but four numbers that were "rounded to a conservative value." This article breaks down these four areas one by one.
I. Selection is a chain of triple amplification, while a pump is efficient at only one point
On the flow-head curve of a centrifugal pump, there is only one point with the highest efficiency, known in engineering as the BEP (Best Efficiency Point). Around this point there is a "high-efficiency zone," commonly described in the industry as 70%~120% of rated flow; the further away, the worse both efficiency and stability become. So the first thing in selection should originally be "placing the operating point within the high-efficiency zone," but actual engineering practice is often the opposite: amplify every step a little first.
A publicly available sludge pump selection guide describes this chain very completely: design flow is based on maximum daily treatment capacity multiplied by a peak factor of 1.2~1.4 (another place writes 1.15 times), head is based on the system-calculated value multiplied by a safety margin of 1.15, motor power is based on shaft power multiplied by a service factor of 1.15~1.20, and the pipeline must also retain self-cleaning velocity. The four coefficients are not large individually, but their product is not small.
| Stage | Common Coefficient | Amplified Object | Reason for Amplification |
|---|---|---|---|
| Flow | ×1.15 ~ 1.4 | Design Water Volume | Peak factor and unforeseen water volume |
| Head | ×1.15 | Calculated System Resistance | Resistance increase after pipeline scaling and filter media clogging |
| Motor | ×1.15 ~ 1.25 | Shaft Power | Medium density fluctuation and starting torque |
| Product (self-calculated) | 1.52 ~ 2.01 | Installed Capacity | Each of the three stages "amplified only a little" |
Amplification itself is not wrong—a pump is equipment that must run continuously for more than a decade, and giving no margin is equivalent to giving no room for retreat. The problem is that after amplification, no one goes back to check the operating point: a pump selected at 1.15 times the flow and 1.15 times the head actually runs long-term at only 60% to 70% of rated flow, so the operating point slides to the left of the BEP. Operation on the left side does not bring "power savings" but a series of side effects: pre-swirl at the impeller inlet and secondary flow at the outlet intensify, radial force increases with the deviation, and vibration and bearing load rise; more troublesome is cavitation on the outlet side—the low-pressure zone on the back of the blade collapses bubbles onto the blade, and this damage appears during maintenance as pitting on the back of the blade, while many people only recognize the honeycomb-shaped pits on the inlet side.
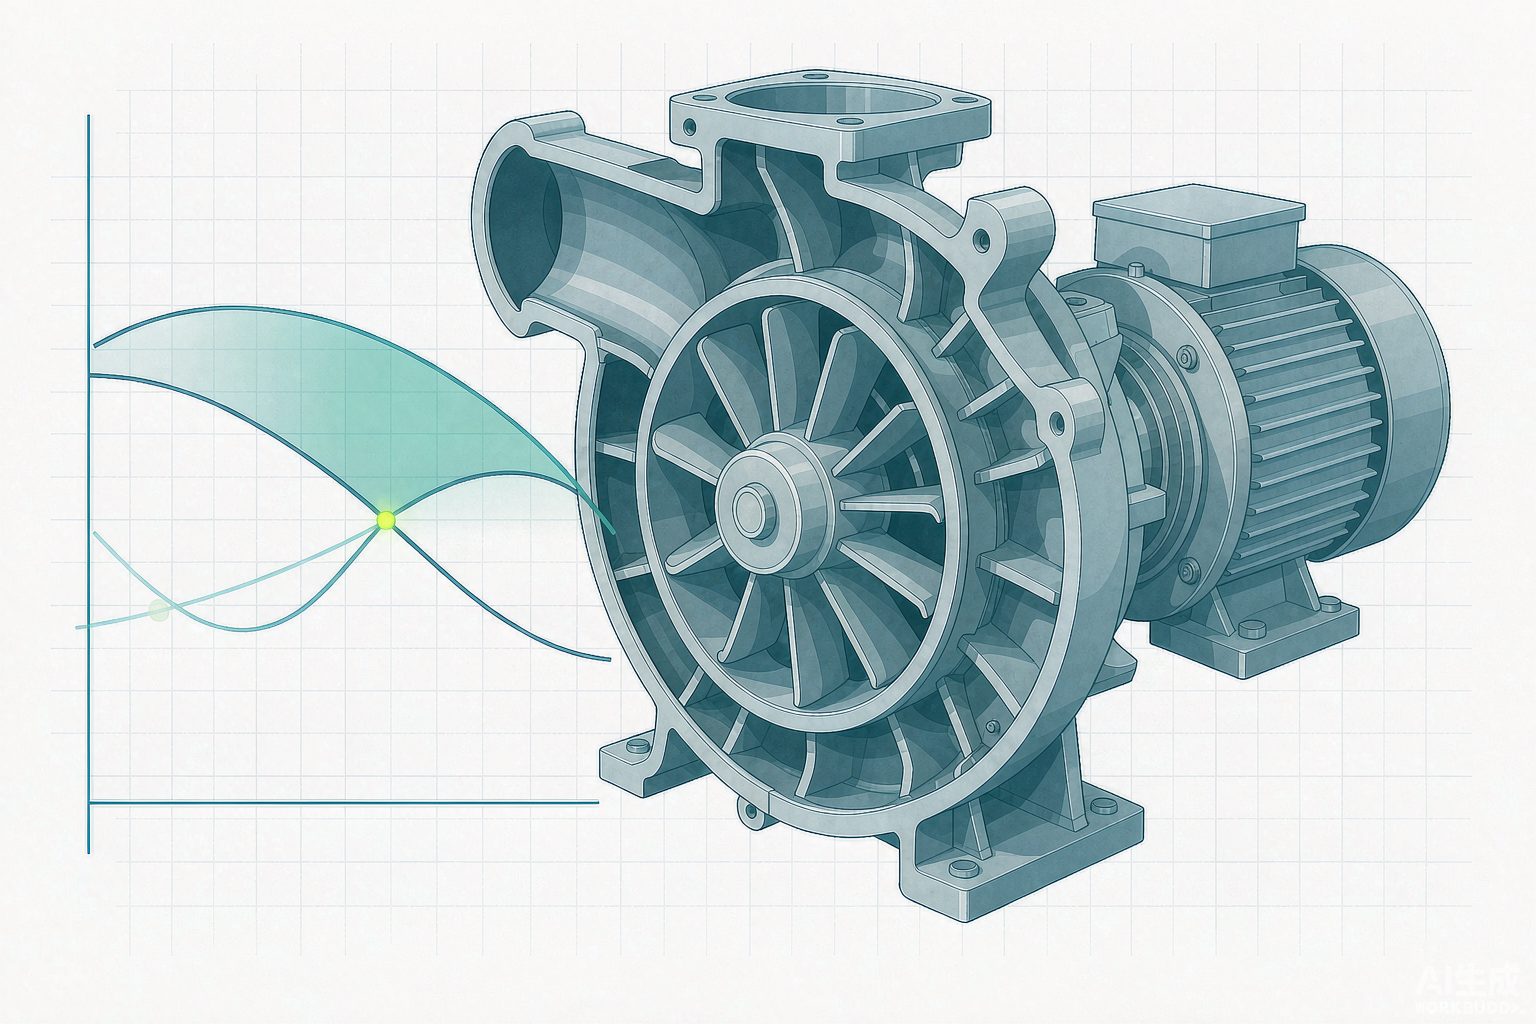
Here is a criterion you can put to direct use: the point on the nameplate is the design point; the operating point is the intersection of the two curves. Whenever you hear "this pump was selected for 200 m³/h," the next question to ask is how much it is actually running now and how far the discharge valve is open—because valve opening changes the piping curve, which can shift the operating point along the entire range while the pump itself remains unchanged.
II. Net Positive Suction Head: NPSHa Belongs to the System, NPSHr Belongs to the Pump
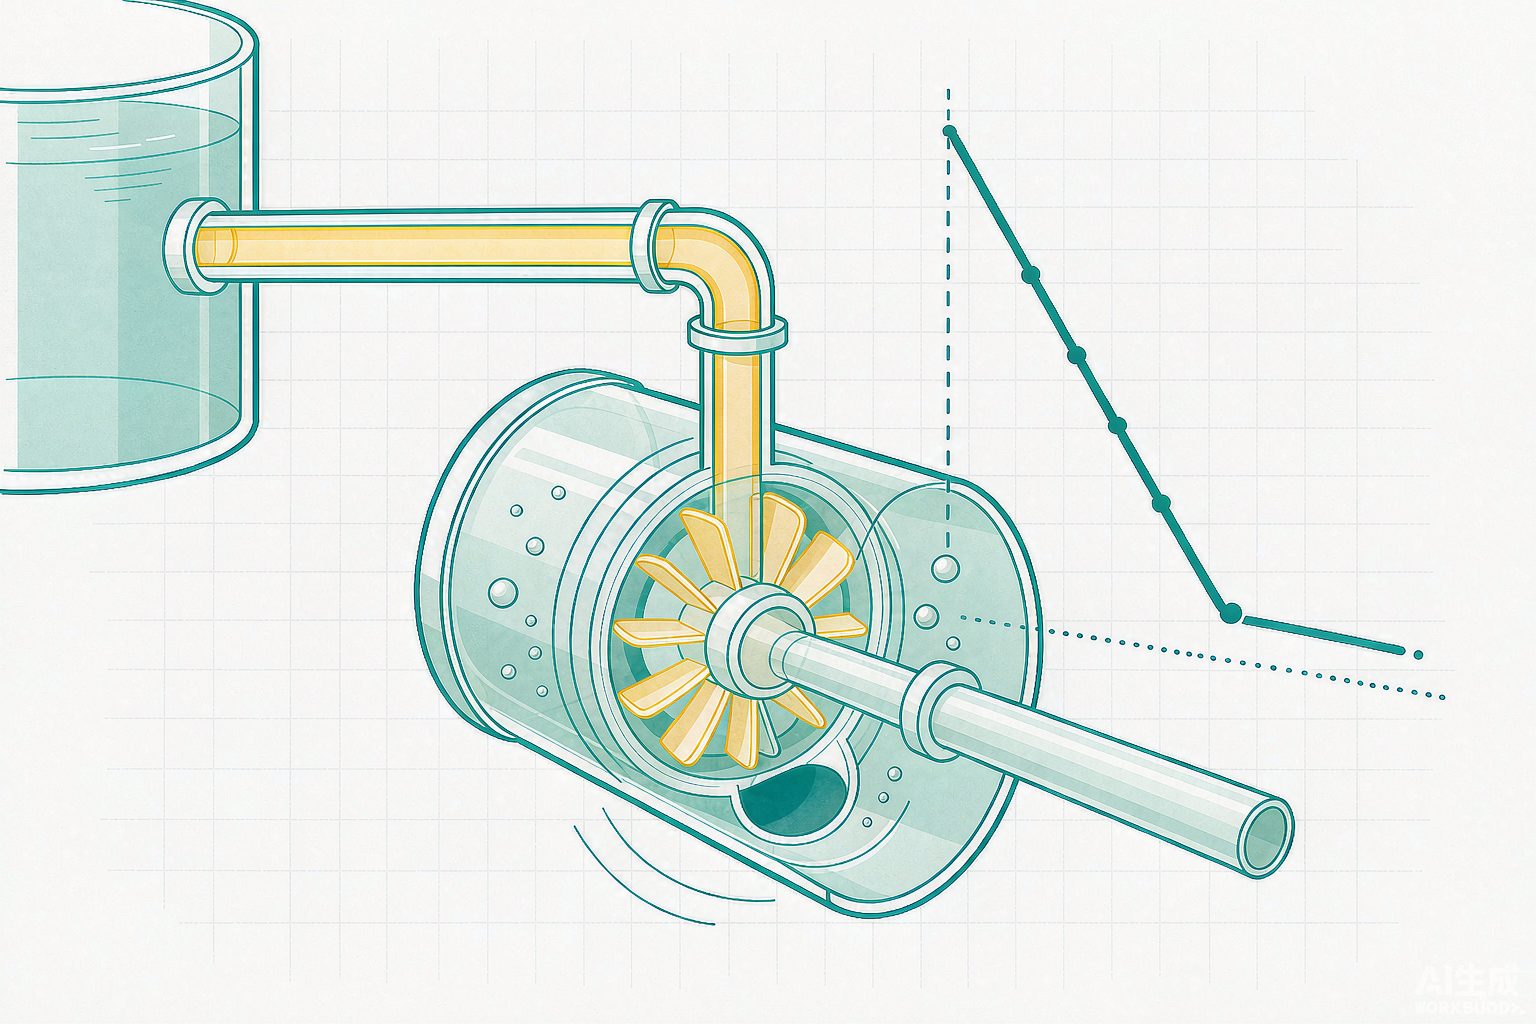
Cavitation is described in textbooks as "the formation and collapse of bubbles," but what is really needed in engineering is a subtraction: the system's available net positive suction head NPSHa minus the pump's required net positive suction head NPSHr leaves the margin. The two are entirely different in nature—NPSHa is determined by installation height, suction pipe losses, liquid surface pressure, and water temperature, and can be changed by the designer; NPSHr is determined by the pump's hydraulic model and is measured by the manufacturer on a test bench (following the ISO 9906 convention, the suction head at which the head drops to 3% is recorded as NPSHr).
How much margin should be left is not given as a single number in public sources, but as three sets:
| Source | Requirement | Notes |
|---|---|---|
| ANSI/HI 9.6.1 | NPSHa/NPSHr = 1.1 ~ 2.5 | Graded by specific speed and suction energy level; low suction energy 0.6 m, high suction energy 1.0 m, high temperature or hydrocarbons 1.5~2.0 m |
| API 610 | NPSHa ≥ NPSHr + 0.6 m (rated flow) | Another common paraphrase is NPSHa ≥ NPSHr×1.1, whichever is greater |
| Engineering Practice | 1.3 ~ 2.0 times | For hot water conditions, no less than 1.5 times is recommended; this is an empirical value, not a code provision |
| Sludge Pump Selection Guide | Difference ≥ 0.5 m | Commercial reference basis, lower than the above two |
The coexistence of four sets of figures is not contradictory, because they answer different questions: the standards answer "how low it must not go at acceptance," while experience answers "how much will remain after five years of operation." What really deserves attention is where the check point is chosen. NPSHr rises with flow rate, while NPSHa falls with flow rate (suction pipe losses grow with the square of the flow rate); the two curves run in opposite directions, so the most dangerous point is not at rated flow but at maximum flow—that is, the moment when pumps are all running in parallel or the outlet valve is fully open. There is another easily overlooked piece of experience in the same engineering documentation: after the impeller inlet surface gradually erodes in service, NPSHr will be 10%~15% higher than the new pump curve, which is also a common reason why "new pumps do not cavitate, but old pumps do."
More concealed than the margin is the suction specific speed Nss. It measures how aggressive a pump is in "pressing NPSHr down," and its formula contains NPSHr raised to the power of 0.75. Industry convention is to keep Nss for general-purpose applications within 11000 (US units), and to press boiler feed pumps down to within 9000; pumps exceeding 12000 are technically fully compliant, but extremely fragile in operation.
The Margin Taken Away by Water Temperature
One term in the NPSHa formula is the saturated vapor pressure, which rises exponentially with temperature, while the density of water declines only slowly. The result is that, for the same suction piping, once the water temperature rises, the margin is almost entirely consumed.
| Water Temperature | Saturated Vapor Pressure (kPa) | Density (kg/m³) | NPSHa (m) | Change Relative to 20℃ |
|---|---|---|---|---|
| 20 ℃ | 2.34 | 998 | 6.41 | — |
| 60 ℃ | 19.92 | 983 | 4.74 | −1.67 m |
| 80 ℃ | 47.39 | 972 | 1.96 | −4.45 m |
| 100 ℃ | 101.33 | 958 | −3.70 | −10.11 m |
Assumptions: open tank at atmospheric pressure, local atmospheric pressure 101.33 kPa, pump suction inlet above the minimum water level 2.5 m, total suction pipe loss 1.2 m. Formula: NPSHa = (Patm − Pv) ÷ (ρg) + Hs − hf.
This table explains a design that is often dismissed as a "crude fix": why the deaerator in a power plant must be mounted on a platform more than twenty meters high. [Self-calculation] The deaerator water temperature is about 104 ℃, and the saturated vapor pressure is about 117 kPa, which is already higher than the local atmospheric pressure; if the deaerator is arranged at elevation 20 m, the suction pipe loss is 1.5 m, and the density is taken as 955 kg/m³, then NPSHa = (101.33 − 117) × 1000 ÷ (955 × 9.81) + 20 − 1.5 ≈ 16.8 m. In other words, what those twenty meters of steel structure buy is not a process position, but 16.8 m of cavitation margin.
III. Rotational Speed and Trimming: The Applicable Boundaries of Two Laws
There are only two ways to adjust pump performance: change the rotational speed, or change the impeller outer diameter. The former follows the affinity laws (flow is proportional to speed to the first power, head to the second power, and power to the third power), while the latter follows the trimming laws, which have exactly the same form except that rotational speed is replaced by impeller outer diameter. Both laws are approximations, and the premise for their validity is "similar operating conditions"—that is, the flow inside the impeller remains geometrically similar, which holds approximately only for small adjustments.
For the allowable amount of trimming, the textbook provides a table classified by specific speed:
| Specific Speed ns | Maximum Allowable Trimming Amount | Empirical Efficiency Drop | Remarks |
|---|---|---|---|
| ≤ 60 | 20% | For every 10% trimmed from the outer diameter, efficiency drops by 1 points | Low specific speed, disc friction loss accounts for a large proportion |
| 60 ~ 120 | 15% | Same as above | The most common range for clean water pumps |
| 120 ~ 200 | 11% | For every 4% trimmed from the outer diameter, efficiency drops by 1 points | The higher the specific speed, the more sensitive to trimming |
| 200 ~ 300 | 9% | Same as above | Approaching the mixed-flow region |
| 300 ~ 350 | 7% | Same as above | Mixed-flow pumps |
| > 350 | 0 | — | Axial-flow and vortex impellers must not be trimmed |
According to this table, for a pump with a specific speed of 60~120, trimming 11% from the outer diameter results in an efficiency drop of approximately 1 points. However, the measured curves in manufacturer catalogs tell a different story: for a pump with a 9-inch impeller, the BEP efficiency is 77%; when trimmed to 8 inches (−11%), it drops to 74%; when trimmed to 7 inches (−23%), it drops to 70%; when trimmed to 6 inches (−33%), only 62% remains. Yet when trimmed by 6% (8.5 inches), the efficiency is still 77%.
The mechanical reason lies in the volute. There is an optimal clearance between the volute tongue and the impeller blades, which a well-designed pump just satisfies at full impeller size; once the impeller is cut down, this clearance increases, the return flow at the outlet increases, and hydraulic efficiency decreases accordingly. So the cost of cutting is not just "the diameter is smaller," but that the matching between the entire volute and the impeller is disrupted. This also explains why engineering practice prefers variable frequency flow control over impeller trimming: the former is reversible and adjustable, while the latter is formed in one pass. The cost is that variable frequency also has its own problems at the low-speed range—when speed drops from 2900 r/min to 1450 r/min, pump efficiency falls by 3~5 points, and heat dissipation of ordinary motors also deteriorates at low speed.
IV. The cube law of variable frequency has a premise that is often omitted
Almost all materials promoting variable frequency energy savings state: power is proportional to the cube of speed; when speed drops to 80%, power remains only 51.2%, saving 49% of electricity. This derivation is not wrong, but it assumes a premise by default—there is no static head in the pipeline. The cube relationship follows the "similar parabola," while the actual operating point is the intersection of the pump curve and the pipeline curve; once the pipeline has static head (lifting height, back pressure of pressure-bearing equipment, elevation difference of high-level tanks), the reductions in flow and head after speed reduction are no longer symmetrical.
[Self-calculation]Take a pump: shutoff head 75 m, design point 120 m³/h, 60 m, pipeline according to H = Hst + kQ². Reduce flow from 120 to 96 (a reduction of 20%), and find the required speed and shaft power:
| Static Head Hst | Share of Design Head | Required Speed | Shaft Power as Share of Original | Energy-Saving Rate |
|---|---|---|---|---|
| 0 m | 0% | 80.0% | 51.2% | 48.8% |
| 20 m | 33% | 85.8% | 60.8% | 39.2% |
| 30 m | 50% | 88.5% | 65.6% | 34.4% |
| 45 m | 75% | 93.0% | 73.6% | 26.4% |
Formula: pump curve H = 75n² − 0.001042Q², pipeline H = Hst + kQ² (k back-calculated from the design point), solved simultaneously for the intersection; power calculated as P ∝ QH, with efficiency treated as constant. Actual efficiency will drop slightly, so the energy-saving rate will be 1~3 points lower than in the table.
This table can explain a long-standing gap: the energy-saving rates advertised by equipment vendors are often 30%~50%, while engineering measurements in reputable journals are often only in the single digits. Taking a sewage pumping station in Guangzhou as an example, after variable-frequency retrofit, the power consumption per ton of water dropped from 0.125 kW·h to 0.113 kW·h, annual power consumption fell by 7.3% year-on-year, with annual electricity savings of about 42 万 kW·h and annual carbon reduction of about 267.9 tCO₂ (Municipal Technology, Issue 12, 2024 年). What differs between 7.3% and 49% is not the level of technology, but the static head of the pumping station—the water in a lift pumping station is almost entirely "lifted" up; once the speed drops, the head must still be sufficient, so the flow naturally cannot be reduced.
Conversely, when China Energy Conservation Network discussed energy saving for petrochemical pumps, it presented both perspectives in the same article: for pumps such as mid-column reflux pumps and overhead cold reflux pumps, where "the suction and discharge liquid level pressures and heights are comparable," the variable-frequency energy-saving rate at low load can reach 60%~70%, with some exceeding 85%; while for pumps with large suction-discharge pressure differences and large elevation differences (high- and medium-pressure process pumps), "even when operating at low load, the proportion of static head is relatively large, and the energy-saving rate after variable-frequency speed control is usually less than 30%." The same article gives two ranges—60%~70% and less than 30%—precisely because it clearly states the preconditions, and this is exactly the part that is most often deleted in secondhand retellings.
V. Running one more pump does not mean double the water
Parallel operation is the most commonly used scheduling method in water treatment plants, and also the place where misjudgments are most common. After two pumps of the same model are connected in parallel, the combined curve is the superposition of the single-pump curves in the flow direction (flow doubles at the same head), but the operating point is still determined by the pipeline curve. The steeper the pipeline (the greater the resistance proportion and the smaller the static head), the smaller the flow increment brought by parallel operation.
| Static Head | Single Pump Flow/Head | Parallel Flow/Head | Flow Multiplier | Power Multiplier | Change in Specific Energy Consumption |
|---|---|---|---|---|---|
| 55 m (Flat Pipeline) | 120 / 60 | 181.5 / 66.4 | 1.51 | 1.67 | +10.6% |
| 45 m | 120 / 60 | 151.8 / 69.0 | 1.27 | 1.45 | +15.0% |
| 20 m (Steep Pipeline) | 120 / 60 | 134.5 / 70.3 | 1.12 | 1.31 | +17.2% |
Assumptions: Pump curve H = 75 − 0.001042Q², pipeline H = Hst + kQ² (k back-calculated from the design point), both pumps at the same speed and efficiency. Specific energy consumption = shaft power ÷ flow rate.
There are two layers to the conclusion. The first layer is quantitative: running one more pump increases the flow rate by at most 51% and at minimum by only 12%, while power consumption will definitely increase by more than 30% — so the saying "one more pump for safety" is expensive in terms of both water and electricity costs. The second layer is qualitative: after parallel connection, the operating point of each pump shifts toward higher flow rates. If a pump was already to the right of the BEP, parallel operation will push both pumps together into a worse region, worsening both vibration and net positive suction head margin simultaneously. This is also why the number of pumps should be configured as "design peak + one standby," while operational scheduling should be based on "how many pumps for how much water is needed, with the rest on variable frequency reduced speed," rather than the intuition that "the more pumps running, the more stable."
VI. Solids-containing media: four sets of "solids content upper limits" refer to four different things
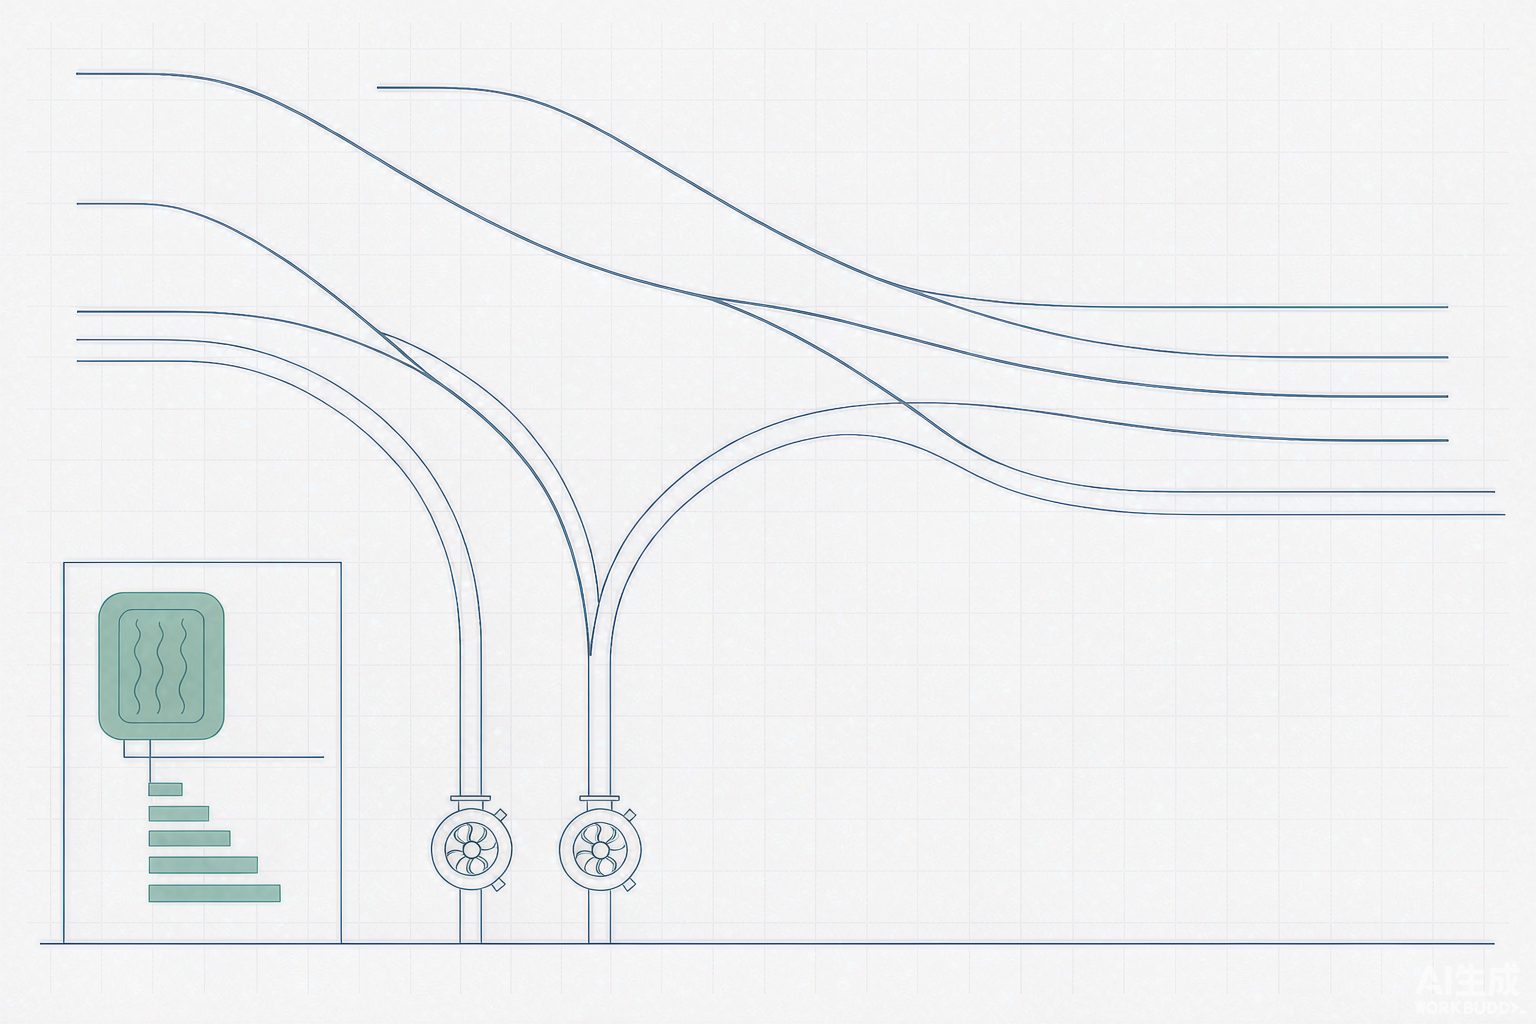
Applying clean water pump experience to sludge and slurry is one of the most common types of failure in water treatment plants. A search of public information reveals that for the single parameter of "solids content upper limit" alone, there are four mutually unequal values:
| Source Type | Pump Type | Stated Upper Limit | What This Number Actually Means |
|---|---|---|---|
| Selection Guide (Industry Media) | Centrifugal Pump | Above 5%, efficiency drops sharply; switch to a positive displacement pump | Efficiency inflection point |
| Selection Guide (Industry Media) | Centrifugal Sludge Pump | Below 3% | Specific application of dilute sludge return |
| Equipment Supplier Catalog | Slurry Pump / Sewage Pump | ≤ 20% | Passage capability (whether particles can pass through the flow channel) |
| Pump Manufacturer Technical Data | Single Screw Pump | Maximum solids content 60% | Boundary of volumetric efficiency and stator life |
| Equipment Supplier Catalog | Single Screw Pump (Silt) | ≤ 80% | The medium is silt, not sludge; the two terms are not the same thing |
None of these four sets of numbers is wrong, because they do not measure the same thing: the upper limit of a centrifugal pump depends on whether particles can pass through (flow channel width, impeller type), the upper limit of a screw pump depends on whether the stator rubber can withstand it (volumetric efficiency, service life), and "≤80%" refers to the medium state (silt, slurry), not "sludge." If these three things are conflated into a single percentage, pump selection will oscillate between "select a screw pump according to 5%" and "select a centrifugal pump according to 20%."
To translate it into a comparable basis, three additional parameters are missing: maximum particle size, particle hardness, and whether the medium is a non-Newtonian fluid. The publicly available data fill exactly these gaps: the viscosity of municipal primary sludge is about 800~1500 mPa·s, that of secondary clarifier Activated Sludge can exceed 2000 mPa·s and is prone to fermentation and gas production; for every 1 percentage point increase in solids content, density increases by about 20~30 kg/m³; and when viscosity exceeds 1000 mPa·s, centrifugal pump efficiency drops by 30%~50%. Only these three together constitute the true meaning of "solids content"—it is not a concentration, but a composite of viscosity, density, and abrasiveness.
| Pump Type | Applicable Solids Content | Advantages | Main Limitations |
|---|---|---|---|
| Centrifugal (including slurry pumps) | <3% (dilute sludge) to ≤20% (slurry) | High flow rate, simple structure, efficiency 78%~82% | At high solids content, impeller clogging and sharp efficiency drop; flushing required |
| Single-screw pump | 5%~12% (sludge before dewatering) | Positive displacement, flow pulsation <5%, low shear without damaging flocs | Stator life 4000~6000 h, replacement about every six months to a year; NPSHr 3.5~5.0 m |
| Rotary lobe pump | 3%~8%, particle size ≤10 mm | Volumetric efficiency 85%~92%, lower maintenance frequency than screw pumps | Large particles require pre-crushing |
| Diaphragm/plunger pump | High pressure, low flow, containing hard particles or highly corrosive | Medium isolated from drive components, pressure up to above 1.6 MPa | Pulsating flow requires a buffer tank; metering accuracy depends on the valve assembly |
To be honest: the "life" of a screw pump is an operating-hour count, not a number of years.A stator life of 4000~6000 h at 20 h of operation per day amounts to only two to three hundred days. "Operating normally" written in the equipment ledger does not mean there is no cost—it merely defers the cost to the next maintenance.
VII. Desulfurization Slurry Pump: Rotational Speed Is the Amplifier of Abrasion
The slurry circulation pump in wet flue gas desulfurization is one of the pumps with the harshest operating conditions in the water treatment field: solids content 10%~20%, pH 4~6, chloride ions often around 20000 mg/L, and the solids are high-hardness gypsum crystals. It must resist both abrasion and corrosion at the same time, and these two failure modes mutually accelerate each other in materials science.
| Material | Key Indicators | Applicable Boundaries | Service Life / Corrosion-Wear Rate |
|---|---|---|---|
| High-Chromium Alloy Cr30A | Cr 28%~32%, Mo 1.8%~2.2% | Wear-dominated, corrosion-secondary; Cl⁻ <20 g/L and pH >4.6 | Flow-path components 1~2 年; impeller 0.46 mm/a |
| Duplex Stainless Steel 2605N | Super-low carbon with nitrogen, PRE > 40 | Resistant to chloride pitting corrosion; manufacturer claims resistance up to 60000 mg/L | Pump body 5 年 or more; 0.78 mm/a |
| Ultra-High Molecular Weight Polyethylene | Low friction coefficient, resistant to weak acids and chloride ions | Corrosion-dominated, temperature stably below 60 ℃ | Softens and deforms above 80 ℃, not resistant to abrasion-corrosion |
| Ceramics | Highest hardness and chemical stability | Extremely harsh conditions, no large-particle impact | Long service life, but brittle and high maintenance cost |
Beyond the material table, there is a conclusion from laboratory research worth mentioning separately. A study published by the Chinese Society for Corrosion and Protection conducted corrosion-wear tests on Cr30A at different rotational speeds using simulated desulfurization slurry, decomposing the total weight loss into three parts: "pure wear," "pure corrosion," and "interaction." At 400 r/min, the interaction accounted for 48.73% of the total loss, meaning corrosion and wear were mutually accelerating; at 800 r/min, the interaction dropped to 10.28%, and a dense oxide film formed on the specimen surface; at 1200 r/min, the interaction became negative, indicating that the two transitioned to mutual inhibition.
The result is somewhat counterintuitive: at low rotational speed, the weight of "corrosion" is actually higher. The engineering implication is that to decide whether a desulfurization pump should have its material changed or its operation modified, one must first determine which category its failure morphology belongs to—if the blades show uniform thinning with pitting and cracks on the surface, the problem lies on the corrosion side, and reducing the rotational speed will not solve it; if grooves are gouged out at the outlet edge and the volute tongue, the problem lies on the erosion side, and reducing the rotational speed is meaningful. Using a single phrase "material upgrade" to cover both failure modes often means the money is spent in the wrong place.
There is another detail that is easily overlooked: the flow-passing components must be of the same material. Mixing different grades for the impeller, shroud, and wear plates will create a potential difference in the slurry, which acts as an electrolyte, causing electrochemical corrosion and instead accelerating overall failure. This point is stated consistently in two independent technical documents, giving it relatively high credibility.
VIII. Sealing: The Scheme Table Determines Service Life More Than the Seal Itself
Mechanical seal failure is mostly not caused by worn sealing faces, but by "the liquid sent into the seal chamber being wrong." API 682 standardizes this with a set of flush scheme numbers; the core of selection is not choosing the seal type, but choosing the scheme.
| Plan | Configuration | Application | Key Parameters / Prohibited Areas |
|---|---|---|---|
| Plan 11 | Pump discharge introduced into seal chamber through orifice for self-flushing | Clean, <80 ℃, solids <10 mg/L; approx. 60% of conventional service | Orifice 3~6 mm, flush rate 0.5~2.0 m³/h |
| Plan 13 | Seal chamber medium returned to pump suction | Standard plan for vertical pumps, easily vaporizing media | Prevent seal chamber overpressure and cavitation |
| Plan 21/23 | With cooler; 23 is a closed small circulation in the seal chamber | 80~180 ℃; 23 for above 150 ℃ | 23 can reduce seal chamber temperature by 30~50 ℃ |
| Plan 31/41 | Cyclone separator separates clean liquid into seal chamber | Particle specific gravity ≥ 2 times that of medium | Explicitly not applicable to slurries and sludges |
| Plan 32 | Continuous injection of external clean liquid | Solids-containing, crystallizing, viscous, corrosive | 0.5~2.0 m³/h, high-pressure seal chamber 0.1~0.2 MPa |
| Plan 52/53A | Dual seal + barrier liquid | Toxic, flammable, high-risk media | 53A barrier liquid 0.15~0.25 MPa higher, leakage <5 mL/h |
Read the table in reverse and it becomes a single criterion: seal failures on solids-containing media are, in eight out of ten cases, "a stream of solids-containing water flushed in with Plan 11." Plan 11 introduces the pump discharge medium directly into the seal chamber, which is reasonable for clean water but for slurry amounts to delivering particles onto the seal faces for grinding. Although Plan 31/41 includes a cyclone separator, the documentation also explicitly states "not applicable to slurries and sludges"—these two boundaries are often overlooked.
Plan 32 also involves a water cost that is easily overlooked.[Self-calculation] If 20 pumps adopt Plan 32, each with 1 m³/h of flushing water and 8000 h of annual operation, the annual flushing water consumption is 16 万 m³; at an industrial tap water rate of 3.5 元/m³, this is approximately 56 万 yuan/year. This money goes into the plant-wide water consumption and comes out of the item "extended seal life." It must be placed in the same table during scheme comparison—otherwise, the result will be "money saved on seals, but hundreds of thousands more in water bills."
IX. Energy Efficiency Standards Have Switched to a New Yardstick (from 2026 年 3 月 1 日)
GB 19762—2025 "Minimum Allowable Values of Energy Efficiency and Energy Efficiency Grades for Centrifugal Pumps" was implemented on 2026 年 3 月 1 日, replacing GB 19762—2007 "Minimum Allowable Values of Energy Efficiency and Evaluating Values of Energy Conservation for Clean Water Centrifugal Pumps" and GB 32284—2015 "Minimum Allowable Values of Energy Efficiency and Energy Efficiency Grades for Petrochemical Centrifugal Pumps." According to the standard interpretation by the Taizhou Institute of Quality Inspection, the key points of the revision include: the scope of application is extended to single-stage single-suction, single-stage double-suction, pipeline, multistage, and light-duty multistage clean water pumps; clean water pumps, petrochemical pumps, and slurry pumps are merged into one standard; the "target minimum allowable values of energy efficiency" and "evaluating values of energy conservation" are deleted and replaced by three energy efficiency grades; and for the same energy efficiency grade, the new standard imposes higher efficiency requirements.
This change has two levels of impact on procurement and technical upgrades. The first level is terminology semantics: documents still using the term "evaluating values of energy conservation" after 2026 年 3 月 cite the old standard system; according to the version change arrangement of the China Quality Certification Centre, from 2025 年 8 月 to the end of 2026 年 2 月, either the old or new standard may be selected, and from 2026 年 3 月 1 日, certification must be implemented according to the new version. The second level is more substantive: energy efficiency grades measure the efficiency at specified points at the factory, while operating energy efficiency depends on the operating point and maintenance status. A pump with 1-grade energy efficiency running continuously at 60% flow may actually be less efficient than a 3-grade energy-efficient unit whose selection closely matches the application.
X. Case Ledger: The Same "Variable Frequency Retrofit," with Power Savings Rates from 7.3% to 50.6%
Putting publicly available engineering data together reveals a very wide distribution. They are all real cases; the difference lies in the role the pump plays in the system.
| Project / Equipment | Scale and Parameters | Measures | Results |
|---|---|---|---|
| A sewage pump station in Guangzhou (journal) | Pump station, continuous annual operation | Variable frequency + water level control | Power consumption per ton of water 0.125→0.113 kW·h, annual power saving 42 万 kW·h (−7.3%), annual carbon reduction 267.9 t |
| Shantou Beizhou Wastewater Treatment Plant (case) | 12 万 m³/d, modified A²/O + MBBR | Variable frequency retrofit of lifting pumps and external return pumps | Power consumption per unit reduced by 0.0045 kW·h/t, monthly power saving about 1.5 万 kW·h |
| Circulating water pump at a power plant | 315 kW, 6 kV, annual 8000 h | High-voltage variable frequency 43 Hz | Power saving 30.5%, annual electricity cost saving 47.5 万 yuan (electricity price 0.70 元) |
| Circulating pump at a power plant (equipment supplier) | 64LKXA-20, 1600 kW, 19726 m³/h | Variable frequency to 80/70/60% flow | Power saving rate 25.1%/38.7%/50.6% |
| A 10 万 m³/d wastewater treatment plant | 3×110 kW influent pumps | Variable frequency | Annual power saving about 42 万 kW·h, comprehensive energy consumption reduced by about 30% |
| A 5 万 m³/d wastewater treatment plant (equipment supplier) | 45 kW×3 changed to 37 kW×3 | Variable frequency + liquid level control | Annual power consumption 42 万 kWh→30 万 kWh, electricity cost 38.2→27.5 万 yuan |
| Wastewater at an industrial park (equipment supplier) | Cast iron impeller pump changed to 316L | Material upgrade | Average service life 8 months→22 months, two-year replacement cost 14.6→9.8 万 yuan |
Note: The first two cases come from publicly available cases of journals and industry associations; the latter five come from equipment suppliers and industry media, which are commercial sources and are for directional reference only. The differences in power saving rates in the table are mainly determined by the proportion of static head, the range of water flow adjustment, and the original adjustment method (valve throttling), and cannot be compared horizontally.
Put these seven sets of figures together, and the most informative are the two ends: the pumping station's 7.3% and the power plant circulating pump's 50.6%. The pumping station's flow is determined by the incoming water from upstream; variable frequency can only adjust it slightly, and the lift height is almost entirely static head. The power plant circulating pump's flow varies greatly with condenser vacuum and seasonal temperature; static head accounts for only about thirty percent of the shut-off head, leaving large room for speed reduction. The same "variable frequency retrofit" technology, applied to two systems, differs sevenfold in economic benefit.
XI. Diagnosis: A Pump's Life Is Not Time, but the Cumulative Mass of Solids Passed
Judgments on the operating side can be condensed into six signals, examined in pairs:
Current or power rises at the same flow rate — hydraulic efficiency is declining, pointing to impeller wear, flow passage scaling, or increased wear-ring clearance; flow rate falls at the same opening — system resistance has risen or internal leakage has increased; outlet pressure drops at the same flow rate — likewise a sign of internal leakage or wear; a rise in vibration at 1 times frequency points to imbalance (uneven impeller wear or scaling), a rise at 2 times frequency points to misalignment, and a rise in blade passing frequency to volute tongue clearance or cavitation; bearing temperature rise usually lags behind vibration; a rise in seal leakage requires revisiting the flushing scheme and the medium. The trick to judgment is "same direction and sustained for two months" — single-point fluctuations are meaningless.
For maintenance-side thresholds, several figures from public sources can serve as starting points: wear clearance between the centrifugal pump impeller and volute exceeding 2 mm should be repaired or replaced; the rotor and stator of a screw pump should be inspected every 3000~5000 operating hours; operating efficiency should not fall below 90% of the nameplate efficiency. These figures are not standard provisions but operational experience; their order of magnitude, however, is correct — a pump's efficiency decline is gradual, and by the time it "obviously has no water," it has often already consumed an extra year or two of electricity.
Finally, back to the opening statement. Every parameter in a pump's selection calculation sheet has a source, but the problem is that these sources each carry different premises: the flow coefficient comes from the peak condition, the head margin from the resistance after scaling, the net positive suction head from the new-pump curve, and the solids content from the design water quality. All four premises were each taken once in the "most unfavorable" direction, and stacked together they push the pump to a point where it has never actually operated. Writing these premises out clearly one by one is more useful than buying another, more expensive pump.
Note: Values marked [self-calculated] in this article are derived from public data using the formulas given herein, with assumptions noted alongside the tables; data marked as from equipment vendors or industry media are commercial sources and serve only as directional reference. The illustrations are schematic and do not represent specific equipment structures.
References
- GB 19762—2025 "Minimum Allowable Values of Energy Efficiency and Energy Efficiency Grades for Centrifugal Pumps", implemented on 2026-03-01 (replacing GB 19762—2007 and GB 32284—2015).
- Taizhou Institute of Quality Inspection and Technical Research: "Implementation of the New Standard for Centrifugal Pumps", 2026 年 (interpretation of major changes in GB 19762—2025).
- GB 19762—2007 "Minimum Allowable Values of Energy Efficiency and Energy-Saving Evaluation Values for Clean Water Centrifugal Pumps".
- GB 32284—2015 "Minimum Allowable Values of Energy Efficiency and Energy Efficiency Grades for Centrifugal Pumps in the Petrochemical Industry".
- GB/T 3216 "Rotodynamic Pumps — Hydraulic Performance Acceptance Tests" (accuracy grades 1, 2, and 3).
- ISO 9906 "Rotodynamic pumps — Hydraulic performance acceptance tests" (3% head drop criterion for NPSHr).
- API 610 "Centrifugal Pumps for Petroleum, Petrochemical and Natural Gas Industries".
- ANSI/HI 9.6.1 "Rotodynamic Pumps Guideline for NPSH Margin".
- API 682 "Pumps — Shaft Sealing Systems for Centrifugal and Rotary Pumps" (piping plans Plan 11/13/21/23/31/32/41/52/53).
- Chinese Society for Corrosion and Protection: "Study on the Interactive Damage Failure Behavior of Cr30A Impeller Material of Circulating Pumps in Power Plants under Desulfurization Slurry Corrosive Environment", 2021.
- Thermal Power Industry Network: "Research and Practice of Large Slurry Circulating Desulfurization Pumps" (corrosion-wear rate and service life of 2605N and Cr30A).
- Shi Pump Slurry Pump: "Material Selection for Desulfurization Pumps: How to Adapt to Limestone-Gypsum Wet Desulfurization Conditions".
- Environmental Protection Online: "Sludge Pump Selection Guide: Matching Logic for Solids Content and Viscosity Conditions".
- Environmental Protection Online: "Sludge Pump Selection in Practice: Matching Calculation of Solids Content and NPSH".
- Zhongcheng Pump Industry: "Affinity Laws and Trimming Laws of Centrifugal Pumps" (allowable trimming amount classification table).
- Shanghai Pump Group: "Overview of the Trimming Laws of Water Pumps" (trimming amount and efficiency drop).
- Shandong Bopump Technology: "Centrifugal Pump Efficiency (Part 4) — Efficiency Retention" (measured trimming curves from manufacturer catalogs).
- Shandong University of Technology: "Centrifugal Pumps and Fans: Blade Trimming and Lengthening", Tables 4-4.
- China Energy Conservation Network: "Methods for Energy Saving and Consumption Reduction of Pumps in the Petrochemical Industry" (VFD power saving rate and static head proportion).
- Gongkong: "Application of High-Voltage Frequency Converters in Desulfurization Circulating Water Pump Processes" (315 kW pumps saving 30.5%).
- Fanpu Software: "Frequency Conversion Energy-Saving Strategies for Thermal Power Plants" (three-level power saving rates of 64LKXA-20 circulating pumps).
- Nie Yunfei, Ke Zhenwei: "Application of Frequency Conversion Technology in Energy Saving and Consumption Reduction of Sewage Pumping Stations under the Background of Carbon Emission Reduction", Municipal Technology 2024, 42(12): 61-66, 116.
- China Water Network: "Case: Shantou Beizhou Guangye Environmental Protection Co., Ltd." (12 万 m³/d, variable frequency lifting pumps).
- Quanda Pump Valve: "Energy-Saving Operation and Frequency Conversion Retrofit Solutions for Water Pumps" (power comparison between valve throttling and frequency conversion, commercial source).
- Shandong Daxian Energy Saving and Environmental Protection Technology: "Analysis of Technical Paths for Energy Saving and Consumption Reduction in Wastewater Treatment Plants" (pumps account for 15%~25% of plant power consumption, commercial source).
- Baidu Aicaigou Encyclopedia: "Sludge Pumps in Wastewater Treatment Plants" (impeller-to-volute clearance 2 mm, screw pump inspection cycle).
- Chengli Special Automobile: "Application Examples and Effects of Drainage Pumps in Pumping Stations in Wastewater Treatment" and "Detailed Technical Parameters of Sludge Pumps for Drainage Vehicles" (commercial source).
- Jiangyin Municipal People's Government: Energy-saving acceptance documents for key energy-using units (example of calculating specified-point pump efficiency according to GB 19762—2007).