



 Multi-industry nationwide coverage (municipal wastewater treatment plants, centr
 Pilot to engineering scale (0.2 to 300 tDS/d; single membrane filter press above
Sludge Dewatering: A 20-Point Drop in Moisture Content Does Not Necessarily Halve the Sludge Volume
This workshop deals with water, and what is added is chemicals. Both ultimately land on the same disposal invoice billed by the ton, pulling in opposite directions.
In the sludge dewatering workshop of a wastewater treatment plant, the question most often asked is "how low can the moisture content go". It is not a wrong question, but it omits a more critical premise: after it goes down, does the sludge hauled away become less or more. Because while squeezing the water out, something must be added into the sludge; and that disposal invoice is charged by the ton, without distinguishing how much of that ton is water, how much is sludge, and how much is the chemical just purchased.
1. First do a subtraction: 1 tons of dry solids, moisture content from 80% to 60%
Shrink the problem to the minimum. Suppose there is 1 t of absolutely dry solids at a moisture content of 80%, then the total wet sludge weight is 5.00 t, of which water is 4.00 t. To reduce to a moisture content of 60%, the wet sludge becomes 2.50 t. It looks like a reduction by half, which is also the origin of the industry saying "80 down to 60, volume halved".
But the site cannot reach this figure, because chemicals must be dosed before dewatering. Take the design values of the Shanghai Bailonggang sludge advanced dewatering project as an example: ferric chloride at 8% on a dry basis, lime at 20% on a dry basis [1] [2]. These 28% are not water but solid matter in the real sense; after entering, the dry basis changes from 1.00 t to 1.28 t. Also producing sludge at a moisture content of 60%, the wet sludge is 3.20 t, not 2.50 t. Reduction drops from 50% to 36%.
Switch again to the actual dosing rates of the same plant in 2014 年: ferric chloride 11.8%, lime 30.3% [1], dry basis 1.421 t, wet sludge 3.55 t. Reduction is only 29%. That is to say, the moisture content did indeed drop from 80% to 60%, but the saying "volume halved" has never held true in this plant.
| Scenario | Dry basis /t | Wet sludge at 60% moisture content /t | Water in sludge /t | Reduction relative to 80% wet sludge |
|---|---|---|---|---|
| Ideal: no chemical dosing | 1.00 | 2.50 | 1.50 | 50% |
| Design: FeCl₃ 8% + lime 20% | 1.28 | 3.20 | 1.92 | 36% |
| Actual: FeCl₃ 11.8% + lime 30.3% | 1.42 | 3.55 | 2.13 | 29% |
The fourth column is the one most easily overlooked in this table. With the same labeled moisture content of 60%, the sludge cake carries away 1.50 t of water without chemical dosing, 1.92 t of water at the design dosage, and 2.13 t of water at the actual operating dosage. Moisture content is a ratio, not a quantity of water. As the denominator (dry basis) increases while the ratio stays the same, more water is actually carried away with the sludge. Therefore, the phrase "moisture content 60%" by itself says nothing about how much water is hauled out, nor how much sludge is hauled out.
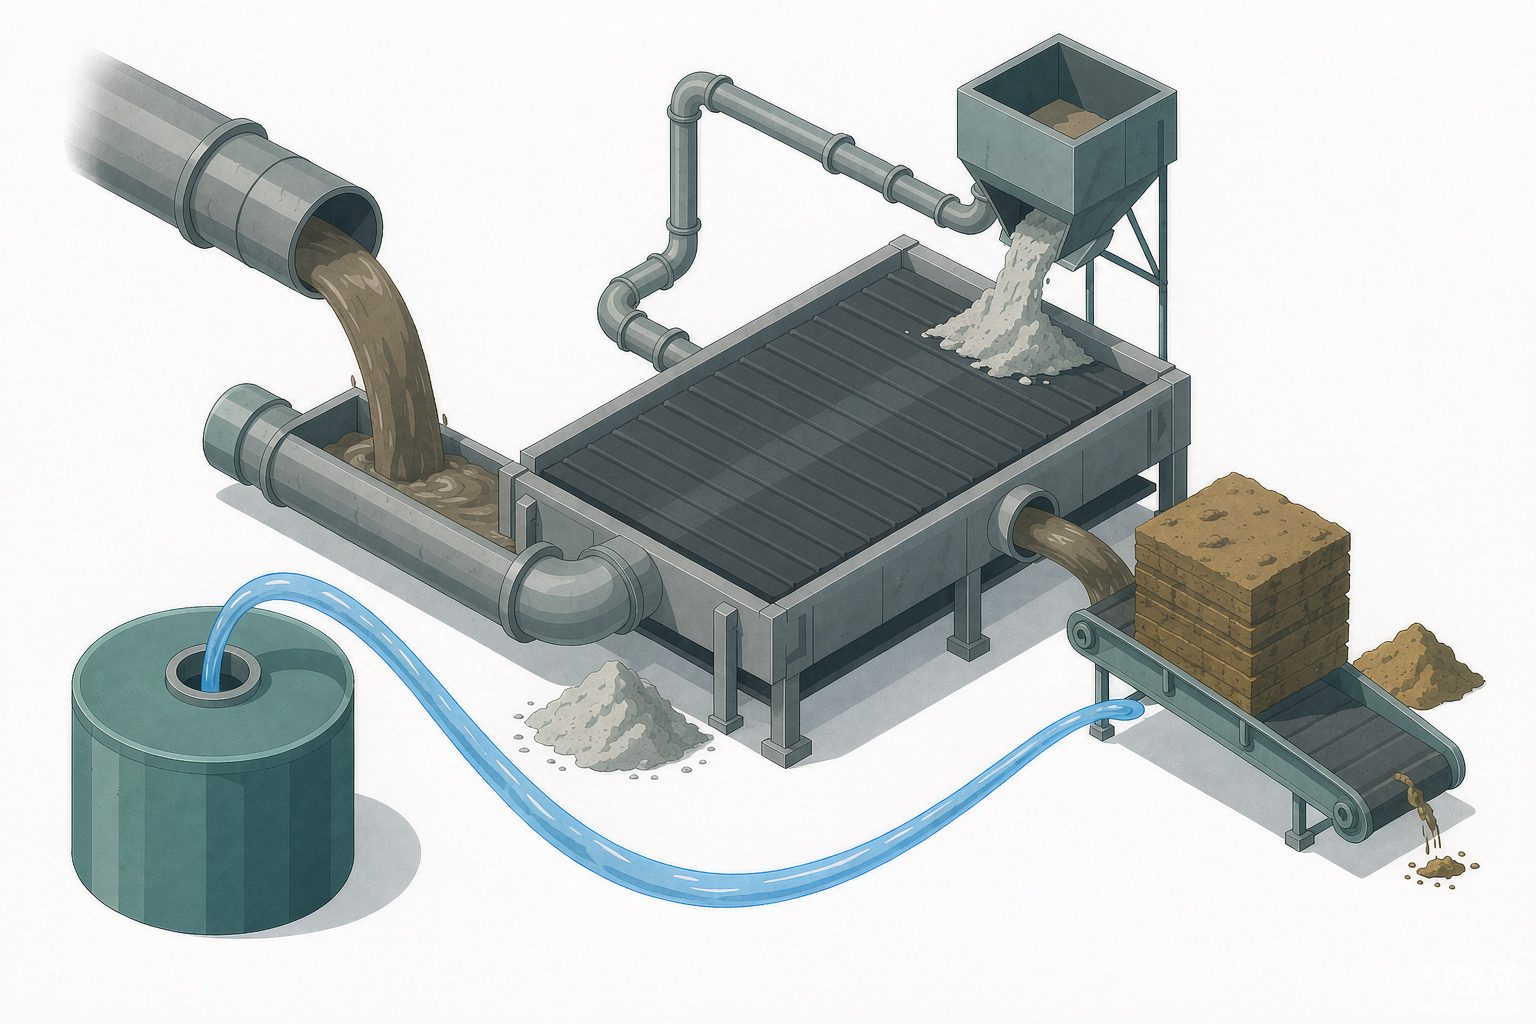
II. The same sentence "dosing 8%" has four readings
The 8% above appears in four different guises across technical agreements, operating reports and purchase orders, differing from one another by as much as several dozen times, and all four formulations are legitimate.
The first is pure product on a dry basis: 8% means the mass of anhydrous FeCl₃ as a percentage of the mass of absolutely dry sludge, 8%. The second is commercial liquid on a dry basis: ferric chloride commercial product is usually a 38%~41% liquid, so to dose 8 parts of pure product, the pump must deliver 8÷0.38 ≈ 21 parts of liquid. The third is on a wet sludge basis: at a moisture content of 80%, 8% on a dry basis equals 1.6% on a wet sludge basis. The fourth is on a diluted feed basis: this project dilutes the sludge to a moisture content of 95% before it enters the conditioning tank, at which point 8% on a dry basis becomes only 0.4% on a feed basis.
| Reading | Denominator | Converted Daily Dosage | Common Pitfall |
|---|---|---|---|
| Pure basis to dry basis | Absolutely dry sludge 300 t | 24 t/d pure FeCl₃ | Mostly used for design values and EIA values |
| Commercial liquid to dry basis | Same as above, converted at 38% | About 63 t/d liquid | Pump selection and tank volume must be based on this one |
| To wet sludge (80%) | Wet sludge 1500 t | 1.6% | Often written in operating reports, looks very small |
| To diluted feed (95%) | Feed 6000 t | 0.4% | Does not match the stroke of the online dosing pump |
Among the four readings, only the first and the fourth appear simultaneously in the public materials of the same project, yet they differ by a factor of 20. This is not a documentation error; the denominator has changed. Whenever you see any dosing rate, first ask "who is the denominator"—this one question can prevent all subsequent mismatches in the accounts.
The same issue has another layer when it comes to lime. Lime's 20% is usually calculated as CaO, while what is purchased on site is hydrated lime Ca(OH)₂; 1 parts CaO corresponds to 74÷56 ≈ 1.32 parts Ca(OH)₂; if the commercial lime purity is 90%, the procurement quantity must be further divided by 0.9. Thus "20% lime" on the weigh ticket is 29% of goods. This 45% difference, falling on annual procurement volume and freight, is not a small number.
III. Specific Resistance: The Same Criterion Has Three Orders of Magnitude in Public Data
The indicator that determines "whether this sludge dewaters well" is specific resistance SRF, in units of m/kg, calculated from the constant-pressure filtration test according to the Carman equation. It measures the resistance of a unit dry weight of filter cake to water flow. The trouble is that the criteria available online fall into three tiers, spanning two orders of magnitude.
| Source Type | Criterion | The Question It Actually Answers |
|---|---|---|
| Testing agency Q&A | <1×10¹¹ good; 1~4×10¹¹ moderate; >4×10¹¹ conditioning required | Which grade does this sludge fall into (classification) |
| University research paper | <9.8×10¹² regarded as having good dewatering performance | Can sludge be produced with conventional equipment (threshold) |
| Engineering manual paraphrase | <4.0×10¹³ only then suitable for mechanical dewatering | Can mechanical dewatering be applied (lower limit) |
| UK DAF sludge data | <1×10¹² free dewatering; ≥1×10¹³ chemical conditioning mandatory | Whether chemical dosing is needed (decision point) |
The three sets of figures are not contradictory, because their cut-off points fall at different positions on the curve: 4×10¹¹ is the boundary between "good and moderate", 4×10¹³ is the threshold for "whether mechanical dewatering still holds", and the large stretch in between all belongs to "can be dewatered, but not dewatered dry". What really goes wrong is using the classification line as a threshold—judged by 4×10¹¹, the waste activated sludge of a plant would almost always "require conditioning", yet it has in fact been producing sludge normally all along.
Specific resistance has another counterintuitive property: the thicker the sludge, the higher the specific resistance. Studies using the vacuum filtration method found that once the moisture content drops below 97%, the specific resistance rises significantly [3]. The reason is that solid particles are packed closer together, and the proportion of inter-particle adsorption and internally bound water increases. Therefore, the intuition of "concentrate to the driest possible before feeding the dewatering machine" is a loss in terms of chemical consumption: the water saved in the concentration stage is paid back in the dewatering stage in the form of chemicals.
The rapid indicator that accompanies specific resistance is Capillary Suction Time (CST), measured in seconds, requiring only a few minutes. The commonly accepted engineering threshold is CST below 20 s after conditioning [3] [4]. Its advantage is that no full filtration test is needed; its disadvantage is that it only reflects the rate of water absorption by the filter paper, not the compressibility under high pressure—and the membrane filter press is precisely a high-pressure compression device.
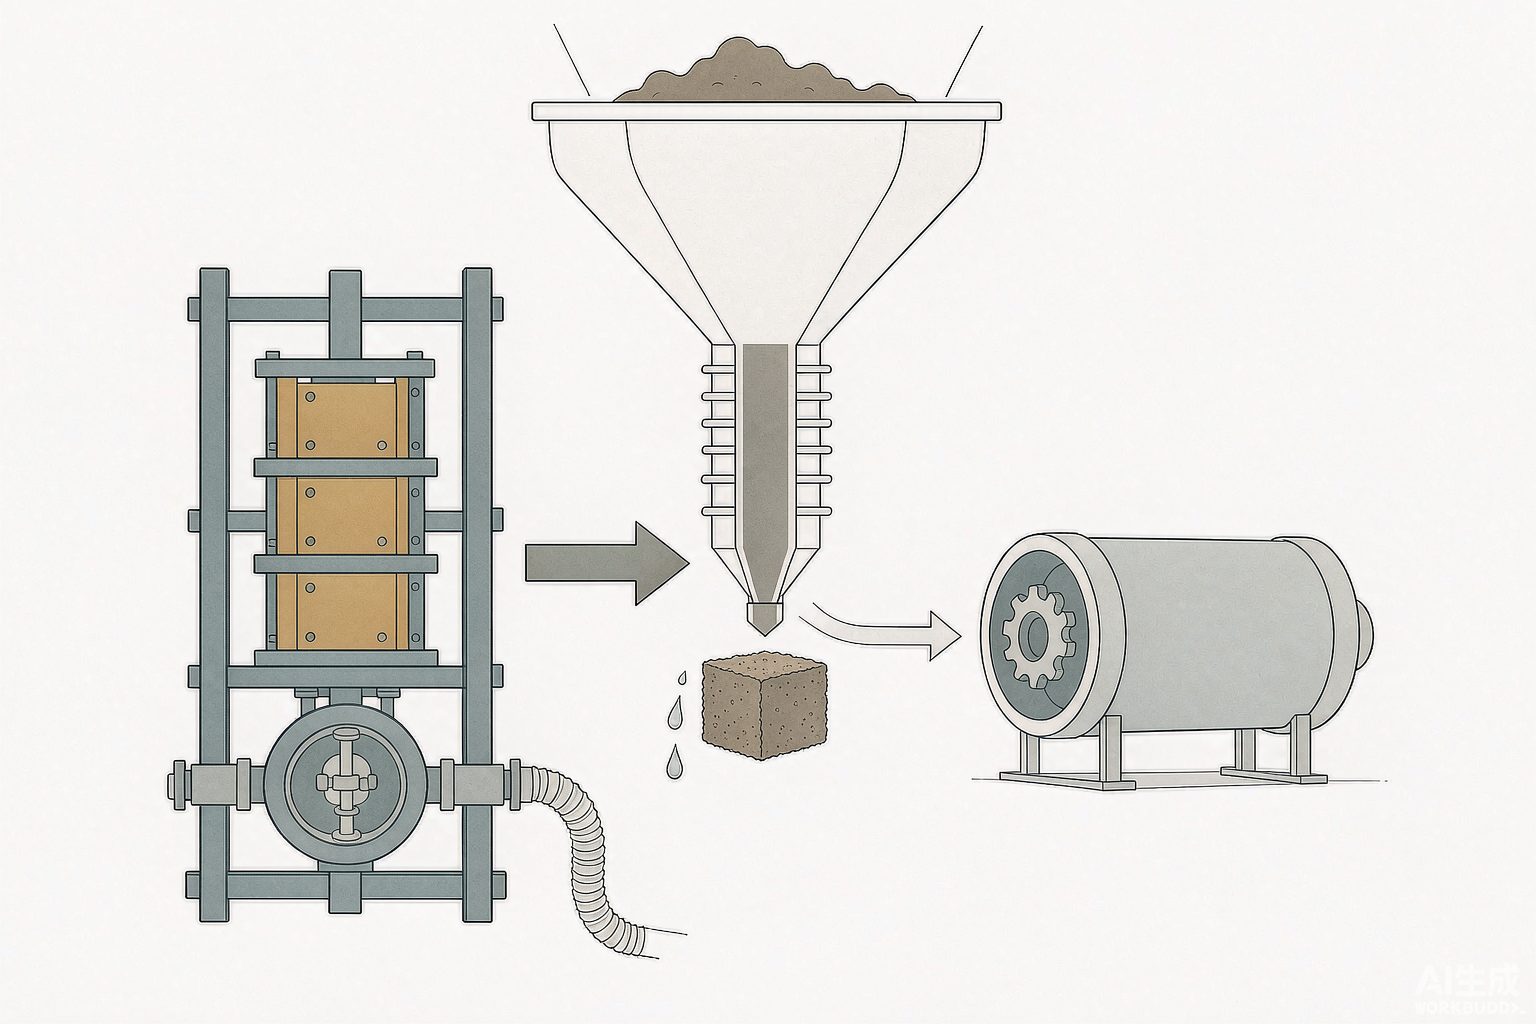
IV. What Conditioning Does: PAM Cannot Provide a Skeleton, Lime Can
Many people understand conditioning as "flocculating fine particles into larger ones," but that is only half of it. Flocculation solves the problem of particles being too fine to be retained by the filter cloth; it cannot solve the problem of the filter cake being flattened under high pressure and all drainage channels being blocked.
The mechanical properties of the flocs are key. Cationic PAM binds particles into flocs of 3~5 mm through charge neutralization and long-chain bridging, releasing interstitial water; this step can remove most of the water in the gravity dewatering stage. However, PAM flocs are flexible and compressible. Once the pressure rises above 0.6 MPa, the flocs deform and crush each other, the porosity of the filter cake drops sharply, and the specific resistance rises again—this is the physical reason why "with PAM alone, the moisture content gets stuck at 78%~80% and cannot go lower."
Lime fills exactly this gap. It provides a rigid skeleton: Ca(OH)₂ and the ferric hydroxide flocs generated by FeCl₃ hydrolysis together prop up tiny drainage channels in the filter cake, and the effect becomes more pronounced at higher pressure; such chemicals are referred to in the literature as skeleton builders. At the same time, lime raises the pH above 12, hydrolyzing extracellular polymeric substances and deactivating cells, releasing a portion of the bound water; Ca²⁺ also crosslinks with carboxyl groups in EPS, altering the water-retention structure of the flocs. Ferric chloride handles the other half: it hydrolyzes to produce acid, neutralizing the negative charge on the surface of sludge particles (measured Zeta potential mostly falls in the −18~−35 mV range), Fe³⁺ complexes with EPS, and provides an iron source for subsequent formation of calcium-iron flocs with lime [5].
| Chemical | Main function | Typical dosage on dry basis | What it cannot solve |
|---|---|---|---|
| Cationic PAM | Charge neutralization + long-chain bridging, forming 3~5 mm flocs | 2~6 kg/tDS | Flocs are compressible; filter cake clogs under high pressure |
| Ferric chloride | Neutralizes negative charge, complexes with EPS, produces acid to aid hydrolysis | 4%~10% (as pure) | Used alone, effluent is acidic and filtrate is corrosive |
| Lime Ca(OH)₂ | Rigid skeleton, cell disruption above pH 12, Ca²⁺ crosslinking | 10%~30% (as CaO) | Increases weight and volume, dilutes calorific value |
| PAC | Inorganic polymer, neutralizes first then bridges, replaces part of the iron salt | 5%~7% | Likewise cannot provide a rigid skeleton |
The dosing sequence is also written into the engineering parameters: ferric chloride is dosed first, and after about 30 min of reaction, lime slurry is dosed; the total maturation time is about 100 min [2]. Reversing the sequence causes the iron salt to be neutralized by the lime first, wasting money. The operating procedures of various plants differ in how this is written, but mechanistically only one order holds.
V. The Inflection Point of Dosage: Add More, and the Moisture Content Rises Instead
More chemical agent is not always better—everyone agrees on paper, yet it is repeatedly misstepped on site. A certain procurement technical document records a very clean control: when the dosage was increased from dry basis 0.3% to 0.8%, the moisture content of the discharged sludge rose instead from 78% to 82%, and the solids content of the filtrate increased simultaneously [6].
There are two mechanisms. The first is charge reversal: excess cationic polymer coats the particle surface, and the surplus positive charge causes the flocs originally formed by electrostatic attraction to repel and disperse again—known in the industry as restabilization. The second is steric hindrance: excess long chains adsorb onto the particle surface to form a protective layer, hindering particles from approaching further. The on-site manifestation of these two effects combined is that the flocs become sticky, larger but loose, floating like cotton wool, and once pressed onto the filter cloth they blind it completely.
Charge density likewise has an optimum point. Municipal biochemical sludge commonly uses a cationic charge density of 30%~50% and a molecular weight of 800 万~1200 万; printing and dyeing and food sludge with high organic matter goes up to 50%~60%; sludge with a high proportion of inorganic matter instead requires a low charge density of 20%~30% [7]. Charge density is not better the higher it is—too high makes the sludge sticky, blinds the filter cloth, and drives up chemical consumption accordingly.
There is also an order-of-magnitude difference worth mentioning separately. The PAM dosage for municipal sludge is 2~6 kg/tDS, whereas for the filter-pressing stage of coal washing slime it is 30~80 g/t dry coal slime [8]—both are written as "on a dry basis," yet they differ by 50~200 times. So the question "how much chemical consumption should my system have" has no industry answer, only a sludge-quality answer. Chemical consumption is not an equipment parameter but a sludge-quality parameter; transplanting a figure across industries will produce an error of two orders of magnitude.
VI. Four Routes: How Far They Can Reach, and at What Cost
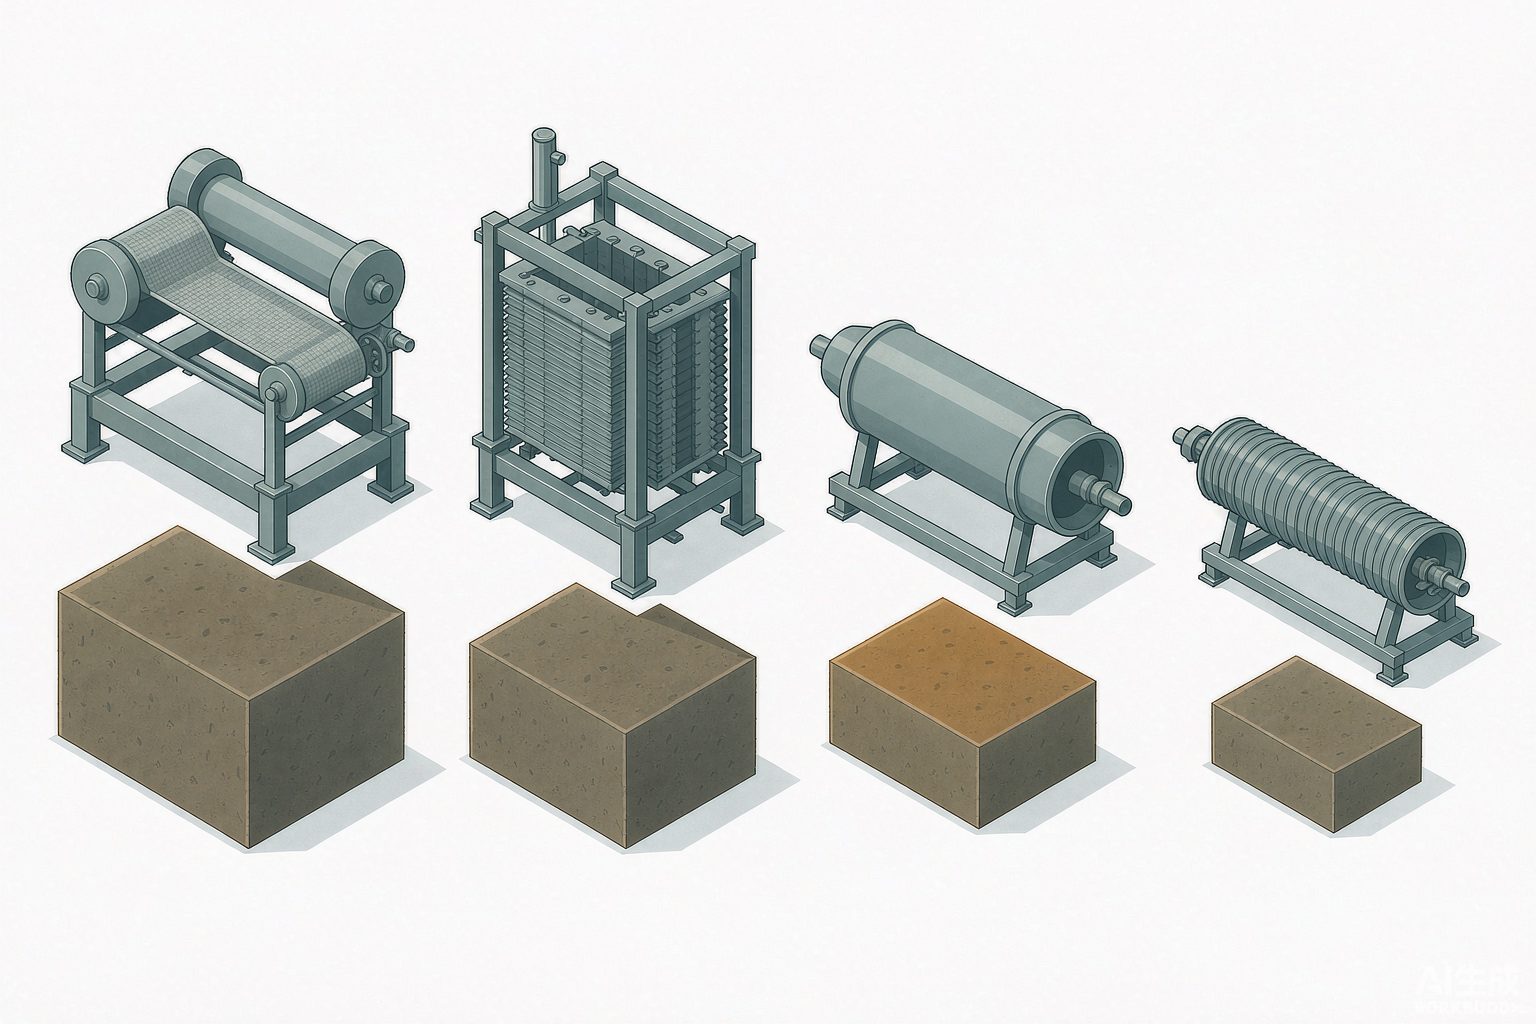
| Route | Cake Moisture Content | PAM / kg·t⁻¹DS | Power Consumption / kWh·t⁻¹DS | Operation Mode | Capacity per Unit |
|---|---|---|---|---|---|
| Belt Filter Press | 78~82% | 3~6 | 15~30 | Continuous | 80~1200 kgDS/h |
| Plate and Frame Filter Press | 60~75% | 2~5 (incl. inorganic) | 8~15 | Batch | 20~300 kgDS/h |
| Membrane Filter Press | 55~60%, high-pressure type up to 45%~50% | 5~8 (incl. inorganic) | 15~30 (incl. squeezing) | Batch | ≥15 tDS/d·unit |
| Decanter Centrifuge | 75~85% | 4~8 | 40~70 | Continuous | 100~1500 kgDS/h |
| Screw Press | 80~88% | 3~7 | 5~15 | Continuous | 30~800 kgDS/h |
The fact in this table that deserves the most attention lies beyond the last column: only one route can reach 55%, and it is batch-operated. Plate and frame and membrane filter presses run in batches, each batch taking 2.5~4 h, including feeding, squeezing, and cake discharge; for the same dry solids throughput, they require more units, more footprint, and more labor than continuous equipment. Therefore, the decision to "go with membrane filter presses" is essentially trading batch operation for cake dryness.
The parameters of the membrane filter press also have clear boundaries. The technical conditions of a 300 tDS/d project are written in great detail: feed sludge moisture content 90%~97%, outlet sludge moisture content ≤60%; single-unit processing capacity not less than 15 tDS/d, cycle time per batch ≤4 h; filter plates 2000 mm×2000 mm, 22 sets in total (effective filtration area 800 m²), 1500 mm×1500 mm, 4 sets in total (400 m²), filter chamber thickness 35~50 mm; filtration pressure not less than 15 kg/cm², i.e. approximately 1.5 MPa [2]. The operating recommendations are low-pressure feed 0.6 MPa, high-pressure feed 1.0~1.2 MPa, membrane squeezing 1.2 MPa, with feed and pressure holding totaling 2.5~3 h.
Squeeze pressure is not the higher the better. The same document states it directly: the higher the pressure, the shorter the time per shift, but the service life of the feed screw pump, frame beams, and hydraulic rams shortens accordingly, and energy consumption is also higher; the longer the pressure holding time, the drier the cake, but overall processing efficiency drops significantly. Both directions lead to the same conclusion—parameters must be found during commissioning; copying someone else's recipe is not reliable.
VII. The power consumption column—the unit may be written wrong
In the same batch of "equipment energy consumption comparison" materials, two sets of figures appear for the power consumption of belt filter presses: 0.85~1.60 and 15~30, a difference of more than 20 times, while both are labeled kWh/tDS.
Verify once with what is at hand. For sludge with moisture content 97.5%, 1 m³ contains approximately 25 kgDS. If 0.85 kWh corresponds to 1 tDS, then 1 m³ of wet sludge consumes only 0.85×0.025 ≈ 0.021 kWh—this number is smaller than the rounding error of a mixer and is physically impossible. Conversely, if the unit in that column is actually kWh/m³ of wet sludge, then 0.35 kWh/m³ ÷ 0.025 tDS/m³ = 14 kWh/tDS, which falls exactly at the lower edge of 15~30.After conversion, the two sets of figures are of the same order of magnitude; the problem lies only in the table header.
This criterion can be used as a tool. Whenever you see any kWh/tDS figure, first convert it back to kW using 25 kgDS/m³, then check it against the installed power of the equipment: if it does not match, the unit is wrong. This type of error is very common in bid documents, because the person compiling the table extracted figures from different materials and copied only the numbers, not the units.
VIII. The Bailonggang account: design 8% plus 20%, actual operation 11.8% plus 30.3%
The Shanghai Bailonggang sludge advanced dewatering project is the one among domestic projects of this type with the most completely disclosed parameters. Scale 300 tDS/d (feed sludge moisture content 80%), total investment 2.61 亿 yuan, receiving sludge from 11 wastewater treatment plants, with the main body consisting of 26 membrane filter presses (20 domestic, 6 imported), filtration pressure generally above 1.0 MPa, and outlet sludge meeting the GB/T 23485—2009 mixed landfill requirements [1] [2].
The design dosage rates are ferric chloride 8% and lime 20%. The document also provides a set of absolute quantities that can be cross-checked against each other: ferric chloride 24 t/d, lime 60 t/d, sludge 300 tDS/d, ratio 1∶2.5∶12.5. 24÷300 = 8.0%, 60÷300 = 20.0%, fully consistent with the design values.This chain is self-consistent, indicating that the denominators of both percentages are dry sludge solids and that the values are on a pure basis—this also rules out the reading that "24 t/d is 38% commercial liquid".
But the 2014 年 operating data are another matter: annual average processing 283 tDS/d, ferric chloride dosage rate 11.8%, lime dosage rate 30.3% [1]. Converted to absolute quantities, these are 33.4 t/d and 85.7 t/d, totaling 119 t/d, which is 42% higher than the design value 84 t/d.
| Item | Design | 2014 年 Actual | Difference |
|---|---|---|---|
| Treatment Capacity | 300 tDS/d | 283 tDS/d | −5.7% |
| Ferric Chloride (pure basis, on dry solids) | 8.0% | 11.8% | +48% |
| Lime (as CaO, on dry solids) | 20.0% | 30.3% | +52% |
| Total Chemicals as % of Dry Solids | 28.0% | 42.1% | +14.1 percentage points |
| Chemicals as % of Dry Solids in Sludge Cake | 21.9% | 29.6% | +7.7 percentage points |
The last row is the real message of this table. Based on actual chemical dosage, 29.6% of the dry matter in the sludge cake is chemicals just purchased, and only 70% is sludge. This runs counter to the intuition that "deep dewatering squeezes the water out": some water is indeed squeezed out, but at the same time the dry basis is inflated by 40%.
What is more noteworthy is the reason for the fluctuation. The data provides a month-by-month comparison: the VSS/SS of 1~4 月 sludge is 60%~70%, the sludge is difficult to dewater, and the treatment capacity at this stage is generally lower than 250 tDS/d, with the lime dosage rate rising to 30%~50%; the VSS/SS of 5~8 月 is close to 50%, the treatment capacity is higher than 300 tDS/d, and the lime dosage rate is basically stable below 30% [1]. With the same set of equipment and the same batch of chemicals, the treatment capacity and chemical dosage swing by more than 20% with the organic matter ratio—this is not a matter of operating skill, but a matter of the nature of the incoming sludge. Any fixed-unit-price contract signed on the basis of "chemical consumption per ton of sludge" will deviate here.
IX. A retrofit ledger: moisture content reduced by 23 points, total cost actually increased by 4 万
Let us look at a smaller example. A wastewater treatment plant in an industrial park has a treatment scale of 8000 m³/d, with excess sludge of about 15 tDS/d. Originally there were two belt filter presses, and the sludge cake moisture content was 78%; after the retrofit, one membrane plate-and-frame filter press was installed, and the moisture content dropped to 55%. The various costs are as follows: outsourced disposal cost decreased from 45 万 yuan/year to 22 万 yuan/year; chemical cost increased from 18 万 yuan to 36 万 yuan; electricity cost increased from 5 万 yuan to 8 万 yuan; labor increased from 1 people to 2 people; annual maintenance cost increased by 4 万 yuan. The total annual cost before the retrofit was 68 万 yuan, and after the retrofit 72 万 yuan [9].
The moisture content dropped by 23 percentage points, and the total cost increased by 4 万 yuan. This result is counterintuitive, but the accounts themselves are self-consistent and can be verified item by item:
- The disposal cost item can be back-calculated to determine the billing method. 15 tDS/d at a moisture content of 78% gives wet sludge 15÷0.22 = 68.2 t/d; calculated at 330 d/a, this is 22 506 t/a, and 45 万 yuan ÷ 22 506 t = 20.0 元/t. After the retrofit, 15÷0.45 = 33.3 t/d, 10 989 t/a, and 22 万 yuan ÷ 10 989 t = 20.0 元/t. The unit price is exactly the same, indicating that it is billed by wet sludge tonnage, at 20 元/t.
- The doubling of the chemical cost item is inevitable. Changing from a single PAM to PAM plus lime plus iron salts increased the chemical cost from 18 万 to 36 万, and the increase is exactly of the same order of magnitude as the formulation used at Bailonggang mentioned earlier.
- The sum of the four items has already offset most of the benefit. Disposal −23 万, chemicals +18 万, electricity +3 万, maintenance +4 万, the total is already +2 万; adding the labor increment gives the reported +4 万.
Therefore, under its billing method, this retrofit is not cost-effective for only one reason: the downstream is landfill, and 78% already meets the requirements. The reduced 23 points did not bring any compliance benefit, but only brought more expensive chemicals and shorter labor. The benefit of reducing moisture content depends entirely on three things: whether the downstream requires drier material, whether disposal is billed by wet sludge tonnage or dry sludge tonnage, and how high the unit price is. If any one of these three things does not hold, the retrofit is a waste of money.
| Project | Scale | Process and Parameters | Results |
|---|---|---|---|
| Shanghai Bailonggang | 300 tDS/d | FeCl₃ 8% + lime 20%, membrane filter press 1.0 MPa or above | Sludge output ≤60%, actual chemical dosage 42.1% dry basis |
| Co-incineration in a northern city | 200 t/d | PAC 5%~7% + lime 10%~20%, chamber membrane filter press | Moisture content 44.0%~58.5%, lower heating value 3.25~4.22 MJ/kg, chemicals 37~57 元/t (80% sludge) |
| An industrial park | 15 tDS/d | Belt 78% upgraded to membrane plate-and-frame 55% | Disposal cost −23 万/a, chemicals +18 万/a, total cost +4 万/a |
| Electro-osmosis demonstration | 25 t/d | Electro-osmosis + plate-and-frame, no chemicals | 80%~85% → below 40%, 80~120 kWh/t, heating value 4186~5443 kJ/kg |
The electro-osmosis in the last row deserves a special mention. Its approach is "no chemicals, migrating bound water out by electric field," so there is no lime in the sludge cake, and the heating value is actually higher (4186~5443 kJ/kg, compared with 3.25~4.22 MJ/kg for the lime-dosing route, about 28% higher) [3][10]. The cost is power consumption: 80~120 kWh/t, calculated on 1 t wet sludge. Converted as above, this amounts to 400~600 kWh per ton of dry sludge—more than an order of magnitude higher than 15~30 kWh/tDS for membrane filter pressing. Its precondition is precisely that both conditions are met simultaneously: "the sludge is to be incinerated, and the disposal unit price is extremely high."
X. The Standard's Interfaces: 60% and 45% plus 25 kN/m² Are Not the Same Statement
The moisture content pass line is not an industry convention; it is a standard clause. GB/T 23485—2009 "Disposal of Sludge from Municipal Wastewater Treatment Plant — Sludge Quality for Co-landfilling" contains two different pathways, corresponding to two different numbers:
- Co-landfilling with domestic refuse: sludge moisture content less than 60%, and the mixing ratio not exceeding 8%.
- As an additive to landfill cover soil: moisture content less than 45%, and transverse shear strength greater than 25 kN/m², with biological indicators also required to meet the requirements of GB 18918.
These two numbers are not high and low tiers of the same threshold; they are two different uses. Co-landfilling is concerned with "whether the sludge will cause the refuse mass to slip and whether leachate will surge"; cover soil is concerned with "whether this layer of soil can support people and vehicles and whether it will collapse on its own." Shear strength is a soil mechanics indicator and is meaningful only for the latter.
The clause "mixing ratio not exceeding 8%" is even more worth calculating. For a deep dewatering project of 300 t DS/d, with sludge output of 3.55 t/tDS at actual chemical dosage, the daily sludge cake production is approximately 1065 t. To mix into domestic refuse at a ratio of 8%, the landfill's daily refuse intake would need to reach approximately 1.33 万 t. This is the arithmetic root of why deep-dewatered sludge is still "unwanted": it is not that the sludge is not dry enough, but that the capacity at the disposal end is calculated by refuse volume, not by sludge volume.
| Destination | Basis | Moisture Content | Hard Indicators to Be Met Simultaneously |
|---|---|---|---|
| Mixed landfill with domestic waste | GB/T 23485—2009 | <60% | Mixing ratio ≤8%; Table 2 eleven pollutants |
| As cover soil additive | GB/T 23485—2009 Table 3 | <45% | Transverse shear strength >25 kN/m²; odor concentration |
| Landscaping | GB/T 23486—2009 | Stricter (otherwise specified in the standard) | Fecal coliform bacteria value, mortality of helminth eggs |
| Separate incineration or co-incineration | Furnace feed requirements (project side) | Back-calculated from calorific value | Lower heating value threshold, commonly cited at the 3500 kJ/kg level |
XI. Eight Points on Site
- When reporting moisture content, the solids content and dosage rate must be reported at the same time. An acceptance sheet that only reports "dewatered sludge 60%" cannot determine whether what was hauled away is sludge or chemicals.
- Dosage rates must always specify pure basis or commercial product, and whether the denominator is dry basis or wet sludge. Ferric chloride on a pure basis differs from 38% commercial liquid by 2.6 times, and lime expressed as CaO differs from hydrated lime by 1.3~1.5 times.
- Run a specific resistance or CST test before selecting equipment. For sludge with specific resistance above 4×10¹³ m/kg, neither belt presses nor centrifuges need be tried; if CST after conditioning cannot reach 20 s, the chemical dosing is not yet right.
- PAM alone cannot reach 60%. To get below 60%, a rigid skeleton is required; lime or an equivalent agent cannot be omitted; the money saved on chemicals will be paid back in the dewatered sludge moisture content.
- Run a dosage gradient and stop at the point where moisture content starts to rise again. Between 0.3% and 0.8%, the moisture content may first decrease and then increase; judge on site by whether the flocs become sticky and whether the filtrate turns turbid.
- Convert power consumption figures to units first. If kWh/tDS is given, use 1 m³ ≈ 25 kgDS to convert back to kW and check once against the installed power.
- Squeeze pressure and holding time are not better the higher and longer they are. Pressure consumes equipment life, and holding time consumes throughput; parameters should be set by commissioning, and copying recipes is not reliable.
- Before upgrading, calculate the disposal pricing method clearly. If priced per ton of wet sludge, lowering moisture content saves money; if priced per ton of dry sludge, chemical addition increases weight and instead costs more.
XII. Closing in One Sentence
Sludge dewatering is the only unit in the whole plant where "what is put in goes out together with the product." Chemicals added in the reaction tank remain in the water, chemicals added in the dewatering workshop remain in the sludge, and the sludge is a waste body sold by the ton.Therefore, the accounts of this workshop cannot only calculate how much the water is reduced to; they must clearly calculate how much of that ton of sludge cake is water and how much is chemicals. When moisture content drops by 20 points, whether sludge volume is reduced by 30% or by half, the answer is not in the equipment catalog but in the denominator of that dosage rate.
References
- "Exploration of Operation Optimization for Deep Sludge Dewatering in Shanghai," reposted by China Slurry Network: Bailonggang deep sludge dewatering project scale 300 tDS/d, investment 2.61 亿 yuan, 26 sets of membrane filter presses, design FeCl₃ 8% and lime 20%, 2014 年 actual operation 11.8% and 30.3%, monthly VSS/SS versus dosage rate comparison.
- "Sludge Deep Dewatering Project Cases," Sudong Filter Press technical materials: FeCl₃, lime and sludge dosage ratio 1∶2.5∶12.5 (24 t/d, 60 t/d, 300 tDS/d), conditioning tank volume, dosing sequence and maturation 100 min, filter plate specifications and squeezing pressure parameters.
- "Dewatering Technology for Excess Sludge from Municipal Wastewater Treatment Plants," BJX Environmental Protection Network: Tian Yu et al. measured by vacuum filtration that specific resistance increases significantly after moisture content falls below 97%; Sound's electro-osmotic high-dry dewatering reduced 80%~85% to 60%~40%, 80~120 kWh/t, 25 t/d demonstration project and sludge cake calorific value.
- "Pretreatment Before Sludge Dewatering," Jifeng Machinery: mechanical dewatering is suitable only when specific resistance is less than 4.0×10¹³ m/kg or CST is less than 20 s; differences in dewatering performance between primary and excess sludge.
- "Analysis of Dewatering Performance of Decanter Centrifuges in Municipal Sludge Treatment" (compilation of test data from 58 wastewater treatment plants, commercial technical materials): moisture content, specific resistance, CST, Zeta potential and EPS ranges for conventional activated sludge, A²/O and MBR sludge.
- "The Cost Black Hole of Sludge Flocculation Failure: A Procurement Pitfall Guide from Chemical Selection to On-site Operation," Baidu Aicaigou Encyclopedia: when dosage increases from 0.3% to 0.8%, moisture content rises from 78% to 82% and solids in filtrate increase; optimal PAM range and restabilization mechanism.
- "Cationic Polyacrylamide Selection Experimental Analysis and Application Analysis in Various Industries," Haonuo Chemical technical materials: correspondence between charge density grades and sludge characteristics, beaker jar test stirring procedure, common selection misconceptions.
- "Key Points for Industrial-Grade PAM Selection and Filter Press Matching in Coal Washing Wastewater Treatment," Julong Chemical technical materials: cationic PAM 30~80 g/t dry coal sludge in the filter press stage, restabilization caused by overdose, preparation concentration 0.1%~0.15%.
- "Sludge Dewatering Machine Selection Comparison: Plate-and-Frame / Belt / Centrifuge / Screw Press," industry technical self-media: cost accounting for an industrial park 8000 m³/d, 15 tDS/d project converted from belt 78% to membrane plate-and-frame 55% (commercial materials, data not peer-reviewed).
- Li Yalin et al. electro-osmotic dewatering tests: mechanical pressure 18.83 kPa, sludge thickness 1.13 cm, voltage gradient 60 V/cm, initial moisture content 87.45% reduced to 49.14%; synergistic iron salt and persulfate can reduce it below 60%.
- GB/T 23485—2009 "Disposal of Sludge from Municipal Wastewater Treatment Plant — Sludge Quality for Co-landfilling": Table 2 eleven pollutant indicators, Table 3 basic indicators for cover soil (moisture content, odor concentration, transverse shear strength >25 kN/m²), Table 4 biological indicators, Chapter 5 and Chapter 6 sampling and monitoring.
- GB/T 23484—2009 "Disposal of Sludge from Municipal Wastewater Treatment Plant — Classification": definitions of disposal methods such as landfilling, building materials utilization, land application and incineration, and the index of corresponding sludge quality standards.
- GB/T 23486—2009 "Disposal of Sludge from Municipal Wastewater Treatment Plant — Sludge Quality for Landscaping": requirements for moisture content, fecal coliform bacteria value and helminth egg mortality.
- "Review of Sludge Composition Analysis and Disposal Routes for Municipal Wastewater Treatment Plants in China," China Water & Wastewater: interpretation of provisions requiring co-landfilling moisture content <60% and mixing ratio ≤8%, cover soil moisture content <45% and transverse shear strength >25 kN/m².
- "Production Test Study on Synergistic Deep Sludge Dewatering with Refuse Incineration," China Water & Wastewater, 2018, 34(15): 110-115: a project in a northern city 200 t/d, PAC 5%~7% and lime 10%~20%, sludge cake moisture content 44.0%~58.5%, lower heating value 3.25~4.22 MJ/kg, dewatering cycle 2.6~4 h, chemical cost 37~57 元/t.
- "Sludge Dewatering Machine Selection in Practice: Comparison of Multiple Technical Routes and Key Engineering Configuration Points," Environmental Protection Online: dry sludge handling capacity, sludge cake moisture content, unit power consumption and flocculant dosage ranges for four routes.
- "Sludge Reduction Equipment Selection Guide: Comparison of 6 Major Processes and Moisture Content Compliance Solutions," Zhongsheng Environment technical materials: plate-and-frame filtration area selection formula, batch handling capacity 5~8 kgDS/m², comparison of power consumption and investment payback period for each route.
- "Equipment Selection of Sludge Dewatering Machines for Water Treatment Plants," Hankeinor Water: comparison of equipment cost, auxiliary equipment cost, PAM unit consumption and operating hours for belt, plate-and-frame, centrifuge and screw press models.
- "Comparison of Filter Press Selection and Operating Costs," Changhe Filtration: comparison of flocculant unit consumption, sludge cake moisture content and washing water volume between centrifuges and belt filter presses (commercial materials).
- "Sludge Synergist Replacing Lime: An Innovative Solution for Sludge Dewatering," Qingdao Shijun technical materials: manufacturer statements on sludge increment 30%~50%, pH increase and calorific value decrease caused by lime conditioning (commercial materials, values tend toward the upper limit, for reference).
- "Technical Policy for Sludge Treatment, Disposal and Pollution Prevention in Municipal Wastewater Treatment Plants (Trial)," Ministry of Environmental Protection et al., 2009: principles of reduction, stabilization, harmlessness and resource utilization for sludge treatment and disposal, and management requirements for moisture content after dewatering.
- "Sludge Testing After Wastewater Treatment" technical materials: testing requirements for moisture content and transverse shear strength of sludge for landfilling, and cited criterion of lower heating value >3500 kJ/kg for sludge for incineration (secondary materials, recommend verification against project-applicable standards).
The cases and values cited in this article all come from public literature, national standards and publicly available manufacturer materials, with reference numbers indicated in the text. Data provided by manufacturers represent only their own operating conditions; for dosage rates and moisture content, please conduct gradient tests again based on the measured sludge characteristics of this project. The formulas and values for the self-calculated parts in this article are listed in the main text and can be verified.
您提供的内容似乎不完整,缺少需要翻译的中文文本。请提供待翻译的中文内容,我将根据术语表为您翻译成地道的英文。