



 Multi-industry projects across China (photovoltaics and semiconductors, display
 Pilot to full-scale engineering (3,800 to 45,000 m³/d; influent fluoride 4 to 93
Defluoridation: The Limit of Calcium Salts Is 15~30, and the 8 and 2 Required by Standards Need a Different Mechanism
The same "fluoride" has five sets of limits in the standards, only one form that can actually precipitate out of solution, and a portion in the laboratory that cannot be measured at all. Primary calcium salt precipitation stalls at 15~30 mg/L—not because insufficient chemicals were dosed, but because CaF₂ itself has a wall.
In the treatment chain for fluoride-containing wastewater, there is one point most easily misread: influent fluoride 500 mg/L, effluent achieved 24 mg/L, removal rate 95.2%—it looks like a very impressive number; but on the same table, the standard may require 8, 2, or even 1. The remaining 16 mg/L is not something that can be removed by "optimizing a bit more"—it is the portion that calcium fluoride is allowed to leave behind in 25 ℃ water. This article breaks down four things: how many sets of limits there are, what lower bound solubility dictates, how much chemicals and sludge each cost, and whether the number in the laboratory is real.
I. One Word "Fluoride," Five Sets of Limits in the Standards
In the discharge standard system, fluoride is not "one indicator, one number," but "one indicator, branching by industry and destination." Let us first lay out this table; all subsequent process discussions must return to it (Table 1).
| Standard | Applicable Object | Limit | Remarks |
|---|---|---|---|
| GB 8978—1996 Table 4 | Other pollutant discharge units | Grade 1 10; Grade 2 10; Grade 3 20 | Grade 2 is not 20; it is the same as Grade 1 at 10 |
| GB 8978—1996 Table 4 | Low-fluoride areas (water body fluoride <0.5 mg/L) | Grade 1 10; Grade 2 20; Grade 3 30 | Grade 3 is relaxed to 30, the only such case |
| GB 30484—2013 Table 1/Table 2 | Solar cells (existing/new) | 10.0/8.0 | Fluoride is monitored for silicon solar cells |
| GB 30484—2013 Table 3 | Solar cells (special emission limits) | 2.0 | Indirect discharge is consistent with direct discharge (Note 4) |
| GB 39731—2020 Table 1 | Electronics industry (semiconductor devices, etc.) | Direct 10; indirect 20 | Often misquoted as 8/15 |
| DB31/374—2006 | Shanghai semiconductor industry | Grade 1 5; Grade 2 8; Grade 3 20 | Local standards may be stricter than national standards |
| GB 3838—2002 | Surface water Class III/Class IV | 1.0/1.5 | Industrial Park tailwater is often required to meet this |
| GB 5749—2022 | Drinking water | 1.0 | Same value as surface water Class III |
Two points in this table deserve separate mention, because they are repeatedly misstated in secondary sources.
The first point is the Grade II standard of GB 8978. Many documents write it as "Grade I 10, Grade II 20, Grade III 20", but the actual original text specifies for "other pollutant discharge units" 10/10/20—Grade I and Grade II are both 10, and only Grade III is set at 20. This is not a typesetting issue: it means that for Grade II standard units discharging into Class IV and Class V water bodies, the fluoride item is not more lenient than Grade I; the leniency only applies to the Grade III scenario of "discharging into urban sewers and entering secondary sewage treatment plants". If a process is designed according to 20 during a retrofit project, acceptance inspection will fail.
The second point is the fluoride limit in the electronics industry standard. GB 39731—2020 Table 1 Item 12 specifies direct discharge 10 and indirect discharge 20; however, many industry research reports write it as "direct 8, indirect 15", which is copying the figures for solar cells from GB 30484. The two standards apply to different objects (electronics industry / battery industry) and have different figures; if mixed up once, the process route will require an additional stage.
A reusable action: Whenever you see "fluoride limit for a certain industry", first confirm three things—which standard, direct or indirect, and whether it is a special emission limit. The three tiers of GB 30484 (10/8/2) differ by 5 times, and its Note 4 explicitly states that "the indirect discharge limit is consistent with the direct discharge limit", which is opposite in direction to other industry standards (where indirect discharge is generally more lenient) and is most easily misapplied by assumption.
II. The first barrier is not calcium, but pH: fluoride in acid is not F⁻
The prerequisite for calcium fluoride precipitation is the presence of free fluoride ions in the water. Fluoride in water is an acid-base equilibrium:
HF ⇌ H⁺ + F⁻ pKa = 3.17(25 ℃)
Calculated according to this pKa: at pH 2, about 94% of the fluoride exists in the form of HF molecules; at pH 3.17, it is half and half; only above pH 5 does F⁻ account for more than 98%.Adding calcium chloride to water at pH 2, no matter how much is added, little can be precipitated—because the reactant F⁻ itself accounts for only 6%.
This point is most clearly seen in an environmental impact assessment of a fluoride-containing wastewater system at a chip factory: influent pH 1~4, fluoride <500 mg/L; the first step of the process is not adding calcium, but dosing NaOH and H₂SO₄ in the reaction tank to raise the pH, after which CaCl₂ is dosed, then PAC is dosed in the coagulation tank and PAM in the flocculation tank.The order cannot be reversed, because the first step changes the form of fluoride, and the second step changes its solubility.
Fluoride-containing wastewater from photovoltaics and semiconductors has an even more troublesome form: hydrofluoric acid and fluorosilicic acid coexist. Fluorosilicic acid (H₂SiF₆) must first be alkaline-hydrolyzed into fluoride before it can enter the calcium salt reaction; the two pre-reactions given in the EIA document are HF and H₂SiF₆ reacting with NaOH to form NaF and Na₂SiF₆ respectively, which are then precipitated by CaCl₂. That is to say, three pH values are actually acting simultaneously in the same tank: reaction pH (determines the form of fluoride), precipitation pH (determines the form of calcium and competition with carbonate), and discharge pH (6~9, determines compliance). Treating these three pH values as one is the most common operational misunderstanding in such systems.
This is the same structure as the article on 10-05 tannery wastewater: sulfide requires alkaline oxidation, chromium requires acidic reduction, and two pH directions that are opposite cannot be placed in the same tank.Criterion: whenever you see "dosing chemicals to remove a certain ion", first ask whether this ion exists in a precipitable form at the target pH.
III. The second barrier is solubility: the figure 8 is calculated, not measured
The solubility product of calcium fluoride at 25 ℃ is usually taken as 3.9×10⁻¹¹. Let the solubility be s (mol/L), then:
Ksp = [Ca²⁺]·[F⁻]² = s·(2s)² = 4s³ = 3.9×10⁻¹¹
Solving gives s = 2.14×10⁻⁴ mol/L, i.e., calcium 8.6 mg/L, fluoride 8.1 mg/L. This is the origin of the statement "the theoretical maximum solubility of calcium fluoride is about 8 mg/L"—it is calculated from the cube root of the solubility product, not an empirical value measured experimentally. Interestingly, two completely independent paths give the same order of magnitude: the measured value given in the literature is "at 18 ℃, the solubility of calcium fluoride is about 15 mg/L (calculated as CaF₂)", which converted to fluoride is 15×38/78 ≈ 7.3 mg/L. Calculated 8.1, measured 7.3, the difference between the two is less than 10%, indicating that this wall is real.
What really matters is not the number 8, but the way it varies with calcium concentration. Rearranging the above equation:
[F⁻] = (Ksp/[Ca²⁺])1/2
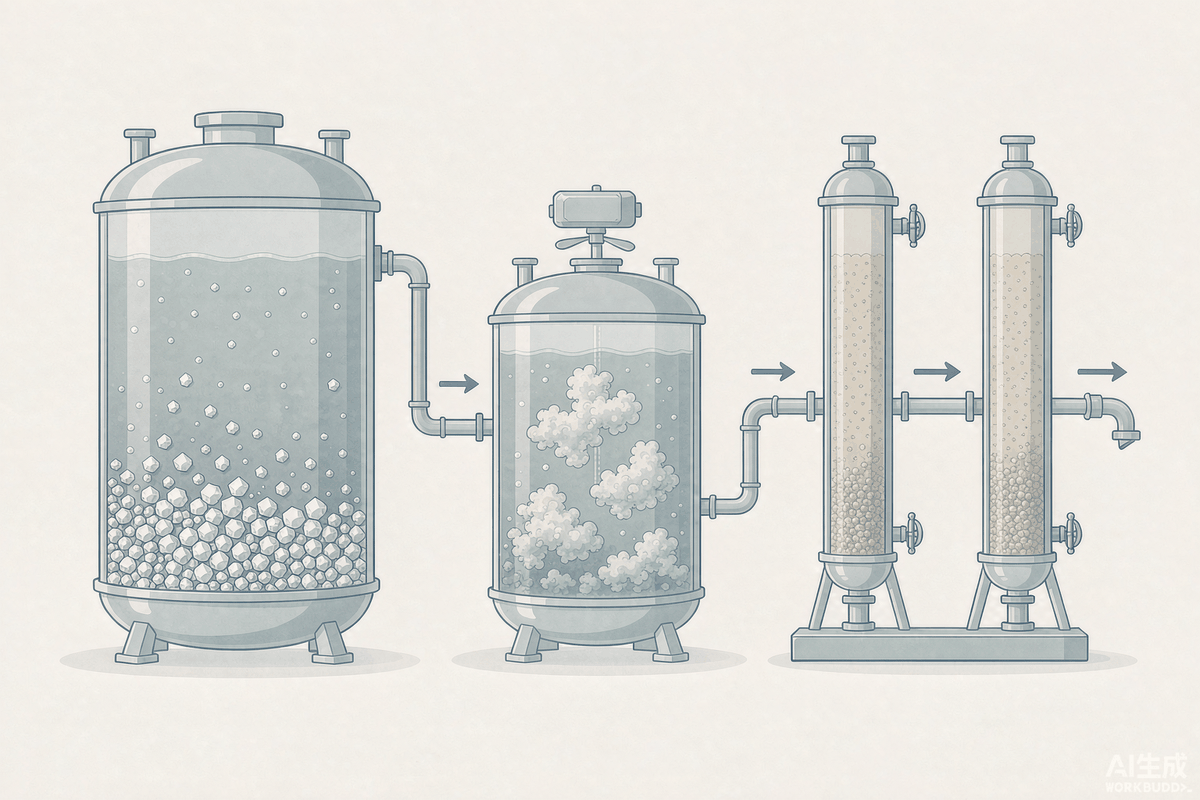
Fluoride is inversely proportional to the square root of calcium. In other words, to halve the fluoride, the calcium must be quadrupled. This inverse-square relationship quickly makes the "just add more calcium" approach a dead end (Table 2).
| Target effluent fluoride, mg/L | Required free Ca, mg/L | Converted to anhydrous CaCl₂, mg/L | Multiple of stoichiometric calcium (8.6 mg/L) |
|---|---|---|---|
| 8.1 (natural solubility) | 8.6 | 24 | 1.0 |
| 4 | 35 | 98 | 4.1 |
| 2 | 141 | 391 | 16.4 |
| 1 | 566 | 1 571 | 65.8 |
| 0.5 | 2 264 | 6 283 | 263 |
Looking at the last two columns of this table, it becomes clear why "adding enough calcium will get you to 1" does not hold up in engineering practice. To reach 1 mg/L, the water would need to maintain 566 mg/L of free calcium, equivalent to 1.6 g/L of calcium chloride; to reach 0.5, it would need to maintain 2.3 g/L of calcium and 6.3 g/L of calcium chloride. At this point, what is coming in is no longer wastewater but brine: every 1 kg of calcium chloride brings in 0.64 kg of chloride ions, and 6.3 g/L of calcium chloride corresponds to 4 g/L of chloride ions—this salinity poses new problems for downstream reuse, for piping materials, and for chloride ion compliance at the discharge outlet. Therefore, the term "advanced defluoridation" is essentially about changing the mechanism, not about the dosage.
IV. Why Engineering Stops at 15~30, Not 8
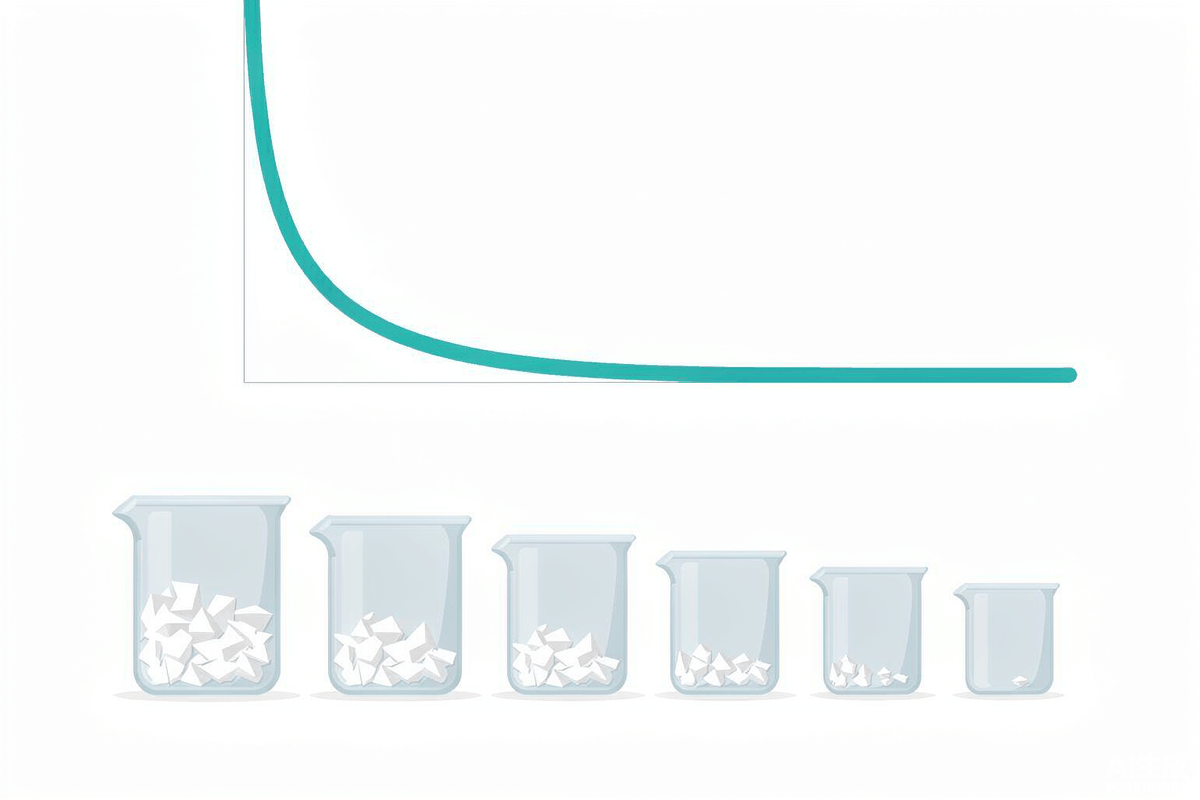
Since the theoretical value is 8, why does on-site primary calcium salt precipitation generally only reach 15~30? An environmental impact assessment of a 2018 年 chip factory puts it bluntly: at the stoichiometric concentration of calcium, the theoretical maximum solubility of calcium fluoride is about 8 mg/L, "but because the formation rate of the precipitate is relatively slow, in conventional precipitation treatment, the fluoride concentration can only be reduced to 15~30 mg/L."
Behind the five words "the formation rate is relatively slow" lie four mechanisms, each corresponding to an adjustable parameter:
- Nucleation and crystal growth. Reaching supersaturation in solution does not mean immediate precipitation; crystal nuclei are required. If there is no seed crystal in the tank and the retention time is insufficient, fluoride remains in a supersaturated state and travels with the water. This is why high-efficiency sedimentation tanks need sludge return and induced crystallization needs seed crystals—the returned sludge is essentially purchased crystal nuclei.
- Competing anions grabbing calcium. Calcium does not only react with fluoride; it binds first with sulfate, carbonate, and phosphate. The calcium grabbed away is equivalent to reducing the denominator in Table 2.
- Crystal encapsulation. This is especially pronounced in the lime process: CaF₂ precipitate coats the surface of undissolved Ca(OH)₂ particles, so the alkali inside cannot be used and the calcium outside cannot get in—chemical consumption is inflated while the endpoint remains unchanged.
- Solid-liquid separation. Calcium fluoride crystals are fine and have poor settling performance. The original EIA text states "calcium fluoride has poor settling performance," so PAC and PAM must follow. The fine crystals carried away by the supernatant will partially redissolve in the effluent—if separation is incomplete, no matter how well the earlier steps are done, it is all for nothing.
Put these onto a real table (Table 3). This EIA simultaneously lists the measured values of three 12-inch chip factories of the same type and the design values of this project, making it a rare internal-external comparison.
| Parameter | Beijing Company | Shenzhen Company | Wuhan Company | This Project Design |
|---|---|---|---|---|
| Fluoride, mg/L | 18.1 | 17.0 | 16.39 | 24 (< 30) |
| Suspended Solids, mg/L | 12.0 | 4 | 32.6 | 20 (< 30) |
| Phosphate (as P), mg/L | — | 6.4 | 5.77 | 15 (< 30) |
| Defluoridation rate based on influent 500 mg/L | 96.4% | 96.6% | 96.7% | 95.2% |
The most noteworthy point in this table is the comparison in the last row: the defluoridation rate of 95%~97% looks good already, but the absolute effluent value still remains at 16~24 mg/L. The reason is simple—the removal rate is relative to the influent; the more concentrated the influent, the larger the absolute value left by the same removal rate. The 4% of 500 mg/L is 20 mg/L, and the 4% of 50 mg/L is 2 mg/L. Therefore, the statement "our removal rate is 96%" cannot answer "whether it can meet the standard"; only the absolute value can.
This point can be used directly as a criterion: Whenever a fluoride-containing wastewater proposal only discusses removal rate and not the absolute values of influent and effluent, recalculate using the absolute values first. There is another, more concealed way of writing this in the industry — "removal rate of 99.5% or above" — which usually refers to the total removal rate calculated by combining two or three stages in series; the actual effluent from the first stage is still above 15.
V. How Much Calcium Do Competing Anions Actually Take Away
The earlier statement that "calcium will be taken away by others" can be calculated into specific numbers. According to the stoichiometric ratio of each product, how much calcium each 100 mg/L of interfering ions consumes (Table 4):
| Interfering Component | Product | Molar Ratio of Calcium to the Component | Ca Consumed per 100 mg/L, mg/L |
|---|---|---|---|
| Sulfate (as SO₄²⁻) | CaSO₄ | 1∶1 | Approx. 42 |
| Phosphate (as P) | Ca₅(PO₄)₃F (fluorapatite) | 5∶3 | Approx. 215 |
| Carbonate alkalinity (as CaCO₃) | CaCO₃ | 1∶1 | Approx. 40 |
| Silicic acid (as SiO₂) | CaSiO₃ | 1∶1 | Approx. 67 |
Looking at Table 4 and Table 2 together, it becomes clear why high-salinity, high-phosphorus fluoride-containing wastewater is difficult to treat. Assuming the influent contains sulfate 1 000 mg/L and phosphate (as P) 100 mg/L, and the fluoride is to be reduced to 2 mg/L (requiring 141 mg/L free calcium), the total calcium dosage must be at least 141 + 420 + 215 = 776 mg/L, equivalent to calcium chloride 2 150 mg/L.Of this, only 18% of the calcium is actually used on fluoride.This is why the same process can achieve 17 mg/L in a segregated stream of wastewater in the electronics industry, but cannot do so when transferred to phosphorus chemical or mine water.
Conversely, phosphate has a counterintuitive role here: the solubility of fluorapatite Ca₅(PO₄)₃F is lower than that of CaF₂, so when an appropriate amount of phosphate is present, fluoride can be reduced to below 8—this is precisely the chemical basis of fluoride removal by induced crystallization of fluorapatite, which is what the literature means by "simultaneous dosing of calcium salts and phosphates can form sparingly soluble fluorine-containing compounds." The conditions are that calcium must be sufficient, and phosphorus must not be so excessive that it sequesters all the calcium. The same ion is a helper when scarce and a competitor when abundant; the dividing line lies in the calcium balance.
VI. The reagent balance: 2.9 kg calcium chloride per kg of fluoride, carrying back 1.9 kg chloride
Calculate the reagent balance to the end according to the stoichiometric ratio of CaF₂ (2 mol F to 1 mol Ca) (Table 5). This is the table most easily overlooked in the design stage, because it simultaneously determines three things: chemical consumption, salinity, and sludge volume.
| Item | Per kg F | Per day (1 900 kg F/d) | Remarks |
|---|---|---|---|
| Theoretical calcium demand | 1.05 kg | 2.0 t | Excludes excess and competitive consumption |
| Converted to anhydrous calcium chloride | 2.92 kg | 5.5 t | CaCl₂ 111/Ca 40 |
| Chloride introduced with the chemical | 1.87 kg | 3.5 t | Cl 70.9/F 38 |
| Converted to hydrated lime Ca(OH)₂ | 1.95 kg | 3.7 t | Also generates unreacted residue |
| Calcium fluoride dry solids | 2.05 kg | 3.9 t | CaF₂ 78/F 38 |
| Sludge cake quantity (moisture content 60%) | 5.1 kg | 9.7 t | Dry solids ÷ 0.4 |
This table contains a flaw that can be checked directly against the tables.In the water quality table of the earlier chip fab EIA, chloride is "design influent < 1400 mg/L, design effluent < 1400 mg/L", with identical influent and effluent values. However, according to Table 5, removing 1 kg fluoride brings back 1.87 kg chloride; if the influent fluoride of 500 mg/L is fully removed, calcium chloride alone introduces approximately 935 mg/L chloride ions, so the effluent cannot still be 1400.
The conclusion is not that this table is falsified, but that it does not count the chlorine from the chemicals — which is very common at the environmental impact assessment stage. The criterion can be fixed: for any water quality table where "calcium chloride is dosed" but "chloride in and out remains unchanged," first recalculate the chloride increment at 1.87 times the fluoride removal amount.
This 1.87-fold chlorine has two further implications, both of which are charged elsewhere:
- Reuse. Chloride is a driver of pitting corrosion in austenitic stainless steel; the material grade and maximum concentration factor of the reuse system must be re-verified based on the chloride after defluoridation. If the raw water chloride is already above 1 000 mg/L, the defluoridated water basically has no reuse value and can only be discharged up to standard.
- Monitoring. In COD measurement, chloride is a reactant fully accounted at 0.226 g oxygen/g chlorine (see the article on 10-23). Defluoridation brings chlorine into the water, which buries a fixed positive bias in the downstream COD data — especially when this stream is mixed with low-concentration water before entering the main outfall, where any change in the mixing ratio changes the COD accordingly.
The sludge column also deserves a pause: 1 kg fluoride produces 2.05 kg calcium fluoride dry solids; a plant of 3 800 m³/d generates 3.9 t dry solids and 9.7 t filter cake per day. This magnitude means that in the cost structure of defluoridation, chemicals and sludge disposal account for the bulk, not electricity consumption. Replacing calcium chloride with lime can save chemical costs, but the lime process residue, calcium carbonate, and encapsulated unreacted alkali will increase the sludge volume — the money saved on chemicals is often paid back in the sludge.
VII. The second stage is not "settling once more," but switching to a different mechanism
Going from 15~30 down to below 8, there are four engineering routes with different mechanisms (Table 6). What they have in common is: none of them continues to increase the calcium concentration; instead, they change the way fluoride is immobilized.
| Route | Mechanism | Key Parameters | Typical Effluent F, mg/L | Main Cost |
|---|---|---|---|---|
| Two-stage calcium salt | Continue using CaF₂; the second stage raises pH and calcium concentration | Second-stage pH raised to 9~11, calcium in excess | 8~15 | Increased salinity and hardness, increased sludge volume |
| Aluminum salt coagulation/coprecipitation | Al³⁺ complexes with F⁻ stepwise (lgβ₆ ≈ 20.2), forming Al(OH)₃₋ₓFₓ coprecipitate that is enmeshed by flocs | pH 5.5~6.5; Al:F molar ratio 10∶1~15∶1 | 5~8 | Large sludge volume, residual aluminum, pH needs readjustment |
| Activated Alumina adsorption | Ligand exchange between surface hydroxyl groups and F⁻ | pH 5.0~6.5; capacity 4~15 mg F/g | 1~2 | Requires acidic influent, requires alkaline regeneration |
| Selective defluoridation resin | Selective adsorption of F⁻ by functional groups, reused after regeneration | Flow rate 8 BV; design adsorption capacity ≈ 3 g/L; single-vessel 2 天 regeneration | <1 | High investment, regeneration waste liquid requires separate treatment |
The aluminum salt route deserves a further note, because its "pH window" is completely opposite to that of the calcium salt route. Calcium salts can precipitate from weakly acidic to neutral conditions, whereas aluminum salts must operate between pH 5.5~6.5: at lower pH aluminum hydrolysis is incomplete, while at higher pH Al(OH)₄⁻ forms and carries a negative charge, repelling F⁻ and markedly reducing the defluoridation rate. Therefore, in a two-stage series system, the second stage often must first lower the pH from the first stage's 8~9, then adjust it back up before discharge—one down and one up means adding acid and alkali twice, and this chemical consumption is frequently overlooked in the design.
For resin, one misuse must be guarded against: resin is for polishing, not the main treatment. Its adsorption capacity is on the order of 3 g/L; if 500 mg/L fluoride is handed directly to the resin, one cubic meter of resin will be saturated after treating less than 6 cubic meters of water. In all 10,000-ton-scale cases, there is a first stage (or two stages) of calcium salt that first knocks the fluoride down to 5~15 mg/L (Table 7).
| Project | Capacity, m³/d | Influent | Advanced Treatment Stage | Effluent F, mg/L |
|---|---|---|---|---|
| Defluoridation Project of an Electronics Enterprise in Shenzhen | 32 000 | Monocrystalline silicon production wastewater; after pretreatment 5~15 | Multi-media filtration + defluoridation resin (10 in service, 2 standby) | <1 |
| A Semiconductor Park in Longhua, Shenzhen | 45 000 | Fluoride-containing semiconductor wastewater | Coagulation sedimentation + biological treatment + Ozonation/BAC + sand filtration + resin | ≤1.0 |
| A Photovoltaic Park in Xishan, Wuxi | 10 000 | Fluoride-containing photovoltaic drainage | Coagulation sedimentation + biological treatment + V-type filter + resin | <1 |
| A Wastewater Treatment Plant in a Development Zone in Wuhu, Anhui | 25 000 | Fluoride-containing photovoltaic drainage (influent ≤8) | Coagulation sedimentation + A²/O + Catalytic Ozonation + resin | ≤1.5 |
| A Defluoridation Station in a Development Zone in Huai'an, Jiangsu | 38 000 | Fluoride-containing photovoltaic drainage | Coagulation sedimentation + dedicated resin | ≤1.5 |
| A New Energy Enterprise in Xinzhou, Shanxi | 21 600 | Fluoride-containing new energy wastewater | Two-stage coagulation sedimentation + two-stage AO + high-density sedimentation + resin | ≤1.0 |
| A Mine Water Project in Ordos, Inner Mongolia | 19 200 | Coal chemical/mine water | Resin defluoridation + Ultrafiltration + Reverse Osmosis | ≤1.0 |
The data in Table 7 come from publicly disclosed cases by engineering contractors and resin suppliers. They are corporate self-reports without third-party monitoring report endorsement, and therefore are only used to gauge the order of magnitude of capacity and process combinations, not as evidence of compliance. Among them, the set of "influent 5~15, effluent <1" is the most valuable reference: it shows that the load borne by the resin stage is 4~14 mg/L, rather than several hundred.
VIII. Back-calculating from the Benchmark Discharge Volume: How Large a Defluoridation Station Does a 5 GW Base Require
In addition to concentration limits, GB 30484—2013 also specifies the benchmark discharge volume per unit product. For silicon solar cells (wafer + cell manufacturing), the benchmark discharge volume is 3.0 m³/kW for existing enterprises, 2.5 m³/kW for new enterprises, and 2.0 m³/kW under special emission limits. These figures allow capacity to be translated directly into water volume:
For a 5 GW cell base, calculated at the new-enterprise rate of 2.5 m³/kW, the annual discharge volume is approximately 1 250 万 m³; converted over 330 production days, the daily discharge volume is approximately 3.8 万 m³/d. This is exactly the same order of magnitude as the 2.5 万, 3.8 万, and 4.5 万 m³/d industrial park defluoridation projects in Table 7—not a coincidence, but because the production capacities behind them are of the same order of magnitude.
This back-calculation has another use: multiplying by the effluent concentration gives the total fluoride emission. At the same 3.8 万 m³/d, an effluent of 8 mg/L corresponds to 304 kg F/d, approximately 100 t/a; an effluent of 1 mg/L corresponds to 38 kg F/d, approximately 12.5 t/a.Tightening the limit from 8 to 1 removes 87% of fluoride emissions—this is why every tightening of the standard by one tier requires an additional full process stage.
IX. The Measurement Hurdle: Electrodes Measure Free Fluoride, and Aluminum Hides Fluoride
The previous eight sections discussed how to remove fluoride; this section addresses a more insidious problem: is that "fluoride 0.8 mg/L" in the effluent real.
GB 7484—87, "Water Quality—Determination of Fluoride—Ion Selective Electrode Method," specifies three total ionic strength adjustment buffers (TISAB) with different formulations, but they share a common feature: all contain chelating agents. TISAB I uses sodium citrate dihydrate, TISAB II uses CDTA (cyclohexanediaminetetraacetic acid), and TISAB III uses Tiron. The chelating agent here is not an auxiliary reagent but a necessity—because Al³⁺, Fe³⁺, and Ca²⁺ all form complexes or precipitates with F⁻, "locking" fluoride in forms that cannot respond to the electrode. The role of TISAB is to release this fraction of fluoride back into free F⁻, while simultaneously fixing ionic strength and controlling pH at 5–5.5 (excessive acidity generates HF and HF₂⁻; excessive alkalinity causes OH⁻ to exchange with the LaF₃ membrane, producing high readings).
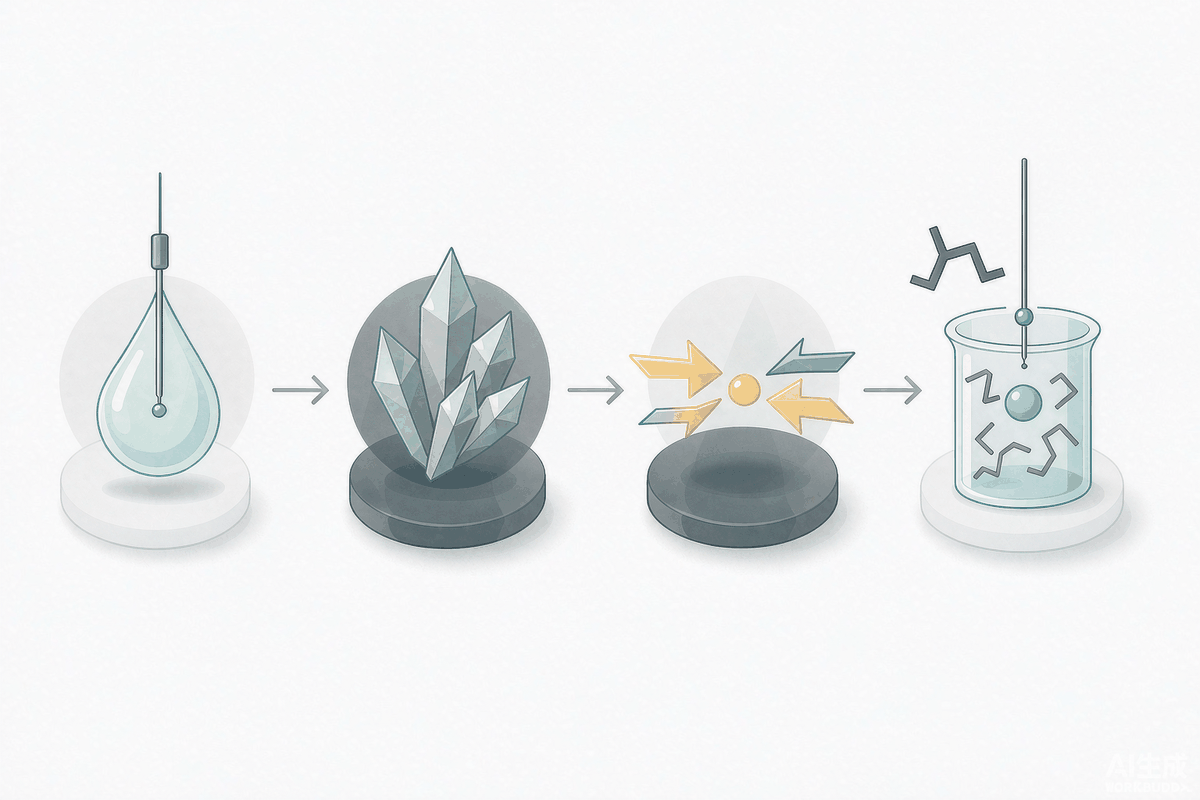
Looking at these two issues together reveals an easily overlooked operational risk. The mechanism of aluminum-salt defluoridation is itself the conversion of fluoride into Al-F complexes and Al(OH)₃₋ₓFₓ flocs. The portion removed by floc settling is genuine removal; but if the aluminum salt is overdosed and the pH is unsuitable (when too high, Al(OH)₄⁻ repels F⁻ and flocs grow poorly), a portion of the fluoride remains in the water as dissolved Al-F complexes. These complexes can pass through 0.45 μm filter membranes and cannot be detected by the ion selective electrode—so the "fluoride 0.5 mg/L" on the lab report may represent only free fluoride, while total fluoride remains above 2 mg/L.
The approach is simple: prepare three aliquots of the same water sample. The first is measured directly with sufficient TISAB per the standard (free fluoride); the second is measured by HJ 84 ion chromatography (total fluoride, as complexes dissociate under acidic elution conditions); the third is acid-digested, neutralized, and then measured.If the three values agree, the fluoride has genuinely been removed; if only the TISAB aliquot reads significantly low, the fluoride has merely been complexed.
This belongs to the same family of problems as "passing QC samples ≠ passing actual water samples" in the 10–12 online monitoring article and "one bottle of water has five CODs" in the 10–23 COD article: a method never measures "how much is in the water," but "how much can be detected under this set of conditions." For the defluoridation unit, the latter deviation is precisely amplified by overdosing—the more chemical dosed, the more complete the complexation, the lower the electrode reading, and the better the results appear.
X. Process Comparison and Key Parameters
| Technology | Applicable Influent F | Achievable Effluent F | Applicable Scenarios | Not Applicable |
|---|---|---|---|---|
| Lime Precipitation | >100 mg/L | 15~30 | First-stage rough treatment for high concentrations; low chemical cost | When 10 or below is required; sludge volume sensitive |
| Calcium Chloride Precipitation | 4~93 000 mg/L | 15~30 | Mainstream first stage in electronics industry; sludge volume lower than lime process | Water systems sensitive to chloride ions |
| Two-Stage Calcium Salt | >50 mg/L | 8~15 | When GB 30484 new 8.0 is required | When 2 or 1 is required |
| Aluminum Salt Coagulation/Coprecipitation | 5~50 mg/L | 5~8 | Polishing stage for low-fluoride water; can be combined in series with calcium salt | High-fluoride water (unacceptable sludge volume) |
| Activated Alumina/Resin | <15 mg/L | 1~2; resin<1 | Terminal polishing, targeting Class III surface water or special emission limits | Direct feed of high-fluoride water (insufficient capacity) |
| Reverse Osmosis | Any (depending on pretreatment) | <0.5 | Reuse and near-zero discharge, with simultaneous desalination | Cases where only fluoride removal without desalination is needed (over-design) |
| Stage | Parameter | Values and Key Points |
|---|---|---|
| pH Adjustment | Reaction zone pH | Calcium salt stage 6~9 (neutralize acidic influent first to convert HF to F⁻) |
| Calcium Dosing | Ca:F molar ratio | Theoretical 0.5; additional dosage based on competing ions (Table 4) |
| Reaction | Retention and mixing | Staged reaction tanks (first stage rapid mixing, second stage slow stirring) to ensure crystal growth time |
| Coagulation Aid | PAC/PAM | Calcium fluoride has poor settleability; both are indispensable |
| Solid-Liquid Separation | Surface loading, sludge return | High-efficiency sedimentation tank relies on return flow to provide crystal nuclei, improving endpoint stability |
| Polishing Stage | Influent fluoride threshold | Resin/activated alumina require influent 5~15, otherwise regeneration frequency is excessive |
| Resin | Flow rate and adsorption capacity | 8 BV; approximately 3 g/L; single tank 2 天 regeneration, multiple tanks rotated in staggered sequence |
| Monitoring | TISAB and parallel methods | TISAB must be added for electrode method; periodically cross-check total fluoride by ion chromatography |
XI. Five Criteria Ready for Direct Application
- "Removal rate 96%" cannot answer the compliance question. The 4% of 500 mg/L is 20 mg/L, and the 4% of 50 mg/L is 2 mg/L. For any fluoride-containing solution, first look at the absolute values of influent and effluent, then look at the removal rate.
- The limit of calcium is solubility, not dosage. Fluoride and calcium have an inverse-square relationship: halving requires four times the calcium, 8 to 2 requires sixteen times, and 8 to 1 requires sixty-six times. Reaching 1 mg/L requires a standing 566 mg/L of free calcium, at which point the water is already brine—deep defluoridation can only be achieved by changing the mechanism.
- The same "fluoride" differs by 5 times across different standards. The three tiers 10/8/2 of GB 30484, the two tiers 10/20 of GB 39731, and 10/10/20 of GB 8978—mixing them once adds an entire treatment stage. When checking limit values, verify the standard number, direct/indirect discharge, and whether it is a special emission limit at the same time.
- Dosing calcium chloride inevitably brings chloride, 1.87 times the fluoride removed. For any water quality table showing "calcium chloride added while chloride ions remain unchanged in influent and effluent," first recalculate the chloride from the dosage; also check the reuse materials and chloride interference with downstream COD.
- When effluent fluoride readings are low, suspect complexation rather than effectiveness first. When aluminum salts are overdosed, some fluoride exists as dissolved Al-F complexes that electrodes cannot measure. Measure once with the electrode method with sufficient TISAB added and once with ion chromatography; if the two numbers disagree, it is "cannot be measured" rather than "removed."
There is one more criterion that is not chemical but equally important: the disposal cost of fluoride-containing sludge must be calculated in the same table as the chemical cost. Each 1 kg of fluoride removed produces 2.05 kg of calcium fluoride dry solids; a 3 800 m³/d system with influent 500 mg/L generates 9.7 t of sludge cake per day (moisture content 60%). In the proposal stage, this cost is often written only as "sludge off-site disposal" without the tonnage.
References
- State Environmental Protection Administration. Integrated Wastewater Discharge Standard: GB 8978—1996 Table 4[S]. 1996.(Table 4 Item 12: Other pollutant discharge units Level 1 10, Level 2 10, Level 3 20; Low-fluoride areas Level 1 10, Level 2 20, Level 3 30)
- Ministry of Environmental Protection. Emission Standard of Pollutants for Battery Industry: GB 30484—2013 Table 1~Table 3[S]. Approved 2013-12-16, implemented 2014-03-01.(Fluoride for solar cells: existing 10.0, new 8.0, special emission limit 2.0; Note 4: indirect discharge limits are consistent with direct discharge limits)
- Ministry of Ecology and Environment. Discharge Standard of Water Pollutants for Electronic Industry: GB 39731—2020 Table 1[S]. Issued 2020-12-08, implemented 2021-07-01.(Item 12 Fluoride: direct discharge 10, indirect discharge 20)
- State Environmental Protection Administration. Water Quality — Determination of Fluoride — Ion Selective Electrode Method: GB 7484—87 §3.3[S].(TISAB Ⅰ: 58.8 g sodium citrate dihydrate + 85 g sodium nitrate; TISAB Ⅱ: 57 mL glacial acetic acid + 58 g sodium chloride + 4.0 g CDTA, pH 5.0~5.5; TISAB Ⅲ: hexamethylenetetramine + potassium nitrate + titanium iron reagent)
- Ministry of Environmental Protection. Water Quality — Determination of Inorganic Anions — Ion Chromatography: HJ 84—2016[S].
- State Environmental Protection Administration. Environmental Quality Standards for Surface Water: GB 3838—2002[S].(Fluoride Class Ⅰ~Ⅲ 1.0, Class Ⅳ~Ⅴ 1.5)
- National Health Commission. Standards for Drinking Water Quality: GB 5749—2022[S].(Fluoride 1.0 mg/L)
- Shanghai Municipal Bureau of Quality and Technical Supervision. Emission Standard of Pollutants for Semiconductor Industry: DB31/374—2006[S].(Fluoride Level 1 5, Level 2 8, Level 3 20)
- China Electronics Engineering Design Institute Co., Ltd. Special Analysis of Environmental Protection Measures for Phase I of the Nanjing Unigroup Storage Technology Co., Ltd. Nanjing Integrated Circuit Base Project[R]. 2018-09: §2.1.2 Fluoride-containing Wastewater Treatment System, Table 2.1-3, Table 2.1-4.(3 800 m³/d; influent pH 1~4, fluoride <500, phosphate <120; theoretical maximum solubility about 8 mg/L, conventional precipitation can only reduce to 15~30; measured values from similar projects 16.39~18.1 mg/L, design value for this project 24 mg/L)
- Kehaisi. Wastewater Defluoridation Project of an Electronics Enterprise in Shenzhen: effluent below 1 mg/L[EB/OL].(32 000 m³/d; after pretreatment SS 20~30, fluorine 5~15; multi-media filtration + defluoridation resin; adsorption flow rate 8 BV, 10 in use with 2 standby, design adsorption capacity 3 g/L, single-tank regeneration cycle 2 天, about 88 h per full cycle; also provides data that at 18 ℃ the solubility of calcium fluoride is about 15 mg/L, equivalent to fluorine 7.76 mg/L)
- China Electronics Environment (Shenzhen SED). Deep Defluoridation: SIE-FDRS Deep Defluoridation Resin System[EB/OL].(Wuxi Xishan 10 000 m³/d, Shenzhen Pinghu 7 200 m³/d, Shenzhen Longhua 45 000 m³/d, effluent F <1 mg/L)
- Nanjing Huachuang Environmental Technology Research Institute. Typical Applications of Advanced Treatment of Fluoride-containing Wastewater[EB/OL].(Shenzhen 45 000 m³/d, Wuhu 25 000 m³/d, Huai'an 38 000 m³/d, Xinzhou 21 600 m³/d, Ordos 19 200 m³/d and their respective process combinations and effluent indicators)
- China Wastewater Treatment Engineering Network. Research on Treatment of Fluoride-containing Wastewater[EB/OL]. 2010.(Calcium salt precipitation endpoint about 15 mg/L; lime method where CaF₂ encapsulates Ca(OH)₂ particles; simultaneous dosing of calcium salts and phosphates can form more insoluble fluorine-containing compounds; mechanisms of fluoride removal by coagulation with aluminum salts and iron salts)
- Jinjiang Municipal People's Government. Environmental Impact Report Form for Relevant Construction Projects[R]. 2022: Table 2-7, Table 2-8.(Indirect discharge of fluoride from electronic components ≤20 mg/L; fluoride in tailwater of the industrial park wastewater treatment plant 1.5 mg/L)
- Suichuan County People's Government. Environmental Impact Report of the Jiangxi Jianji High-tech Silicon Materials Co., Ltd. Annual 40 万 t Quartz Sand Product Purification Project[R].(GB 8978—1996 Table 4: Level 1 F 10 mg/L, Level 3 F 20 mg/L)
- State Environmental Protection Administration. Identification Standards for Hazardous Wastes — Identification for Extraction Toxicity: GB 5085.3[S].(The attribute determination of fluorine-containing sludge shall be based on the generating process and leaching results, see references 10-21)
- Ministry of Environmental Protection. Water Quality — Determination of Fluoride — Fluorine Reagent Spectrophotometric Method: HJ 488—2009[S].(Listed in the normative references of GB 30484—2013, as the second method in addition to the electrode method)
- General Administration of Quality Supervision, Inspection and Quarantine. Wastewater Quality Standards for Discharge to Municipal Sewers: GB/T 31962—2015[S].(Fluoride is one of the control items; when discharging to sewers, check against the industry indirect discharge limits as well)
- US EPA. Fluoride: Exposure and Relative Source Contribution Analysis[R].(Background on exposure and limits of fluoride in drinking water, for reference on the source of the 1.0 mg/L limit)
- World Health Organization. Guidelines for Drinking-water Quality, 4th ed.[R].(Fluoride guideline value 1.5 mg/L, background on the difference from China's 1.0 mg/L)
All data in this article are sourced; the calculation parts (back-calculation of solubility product, chemical and sludge metering, calcium consumption by competing ions, back-calculation of benchmark discharge volume) are self-calculated according to parameters in the standards and original literature, and readers can verify them with the same formulas. Process selection shall be subject to the full water quality analysis and on-site pilot test of this project.
您提供的内容似乎不完整,缺少需要翻译的中文文本。请提供待翻译的中文内容,我将根据术语表为您翻译成地道的英文。