


 Nationwide (coal chemical, coking, petrochem, pharma, dyeing)
 Pilot to full-scale (10s–10,000s m³/d)
Catalytic Ozone Oxidation: Breaking Down Refractory COD Without Iron Sludge — the Hydroxyl Radical Factory for Industrial Wastewater Advanced Treatment
Fenton can oxidize refractory organics, but it produces huge amounts of iron sludge (a hazardous waste), requires acid/alkali adjustment and tends to cause color reversion. Catalytic ozonation takes a different path: ozone plus a metal catalyst generates hydroxyl radicals on the support surface (·OH, redox potential about 2.8 V), tearing benzene and heterocyclic rings into small molecules and raising B/C. Drawing on project cases and review literature, this article explains ozone utilization, the O₃/COD ratio, catalyst life and selection in one pass.
1. Principle: Direct Ozone vs Catalytic Ozone — the Difference Is the Radical
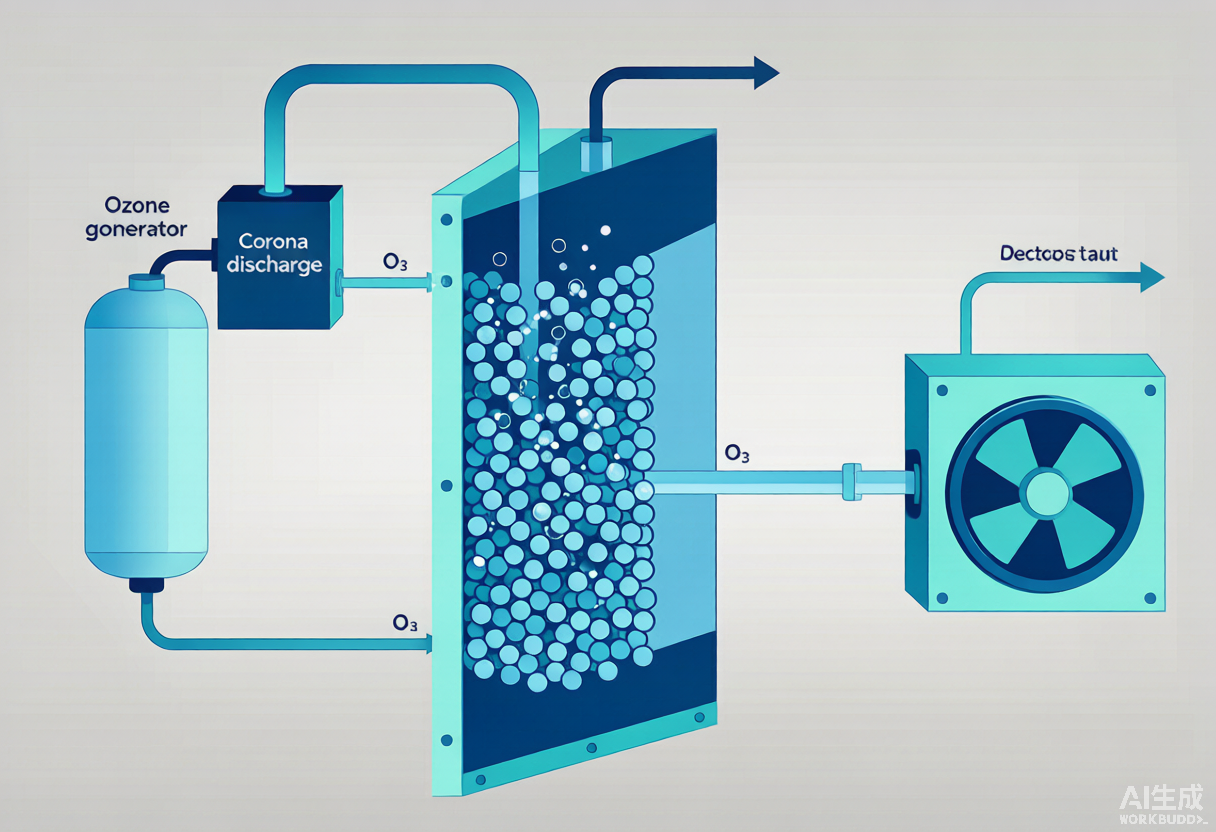
Ozone is already a strong oxidant (E°≈2.07 V), but direct oxidation has two major shortcomings:
- Highly selective: it only electrophilically attacks organics with unsaturated bonds (alkenes, phenols, amines) and can barely get a grip on saturated fatty acids and carboxylic acids;
- Low utilization: ozone has limited solubility in water, and under conventional aeration utilization is only 45%–65%; much of the ozone is discharged with the off-gas, wasting it and requiring off-gas destruction.
Catalytic ozonation packs a catalyst into the reactor so that ozone splits into ·OH (E°≈2.8 V) faster at the catalyst active sites (e.g., Mn³⁺/Mn⁴⁺ and surface hydroxyls). ·OH is non-selective and reacts orders of magnitude faster, so refractory organics are ring-opened and chain-scissioned, raising both the degree of mineralization (TOC removal) and B/C. Studies note that compared with ozone alone, catalytic ozonation can raise TOC/COD removal by 12%–42%, and removal of specific pollutants by 22%–71% (Industrial Water Treatment review, 2020/2026).
2. Three Core Metrics: Utilization, the O₃/COD Ratio and Catalyst Life
① Ozone Utilization — From Half Wasted to Almost Zero Waste
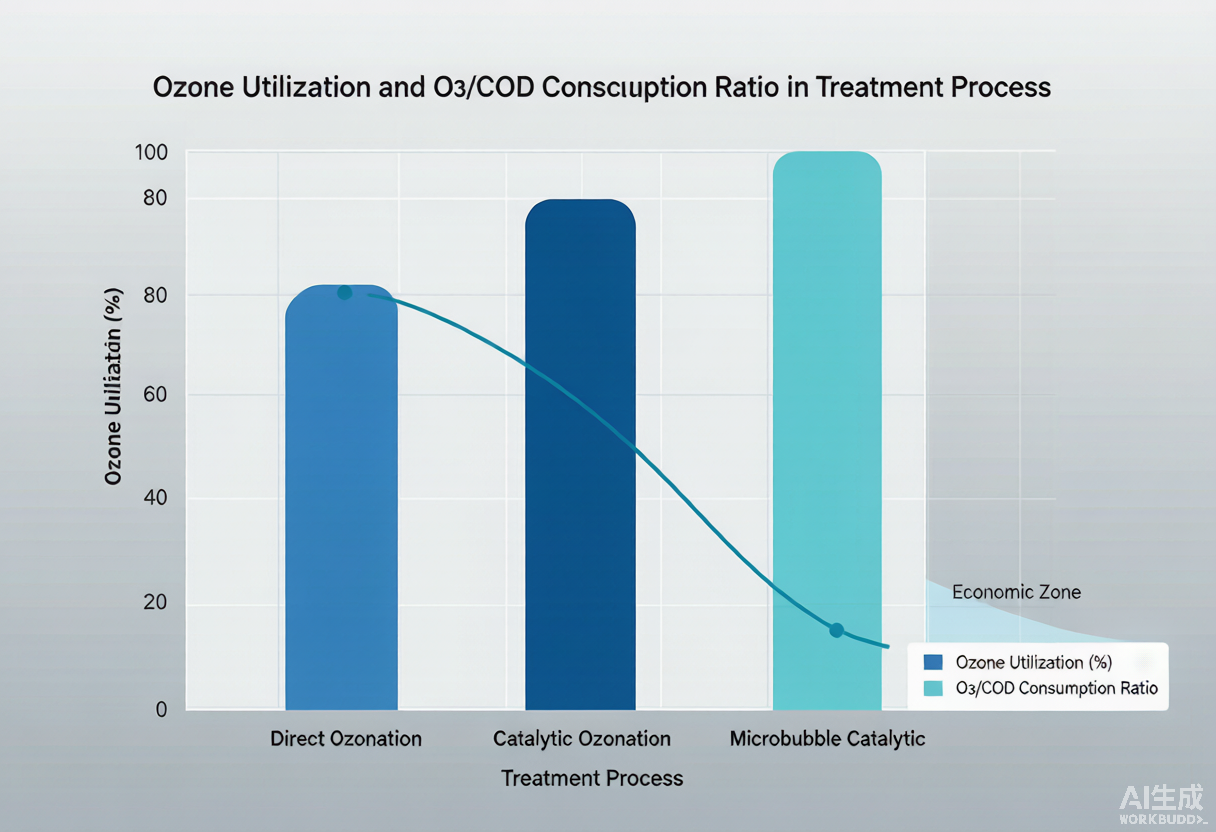
This is the hardest economic calculation in catalytic ozonation. Direct ozone: 45%–65%; after catalysis it is generally 85%–100%: a microbubble ozone catalysis–biological coupling project measured 94.2% / 99.5% / 98.0% across three stages (Hebei University of Science and Technology pilot, reported by sinokle); a coal chemical project case held ozone utilization steadily above 88%. Every notch of higher utilization lowers the ozone generator power draw and the off-gas volume to be treated.
② O₃/COD Ratio — Grams of Ozone per Gram of COD That Sets the Cost
In engineering this is commonly measured as ozone consumed per 1 mg COD removed. Studies report that when treating chemical wastewater, at COD removals of 40%/50%/60% the ratio is about 0.44–0.91 / 0.25–1.0 / 0.44–0.70 mg respectively. As a rule of thumb it should be held within 0.25–0.70 mg/mg to be economical; the microbubble–biological coupling optimum can be pushed to 0.68 mg/mg. A ratio that is too high means the ozone is self-annihilating — literally burning money.
③ Catalyst Life — One Charge Lasts Years
A single catalyst charge is effective for about 1–3 years; commercial catalysts can reach 5 years. The main deactivation causes are carbon fouling, loss of active components and poisoning (high-Ca²⁺/SO₄²⁻ water especially prone to scaling that masks active sites). Most projects regenerate by a combined water-air backwash about every 7 days, flushing out inorganic salts and restoring activity.
3. How to Choose the Catalyst: Mn/Ce/Fe-Based + Support, with Stability in Mind for Engineering
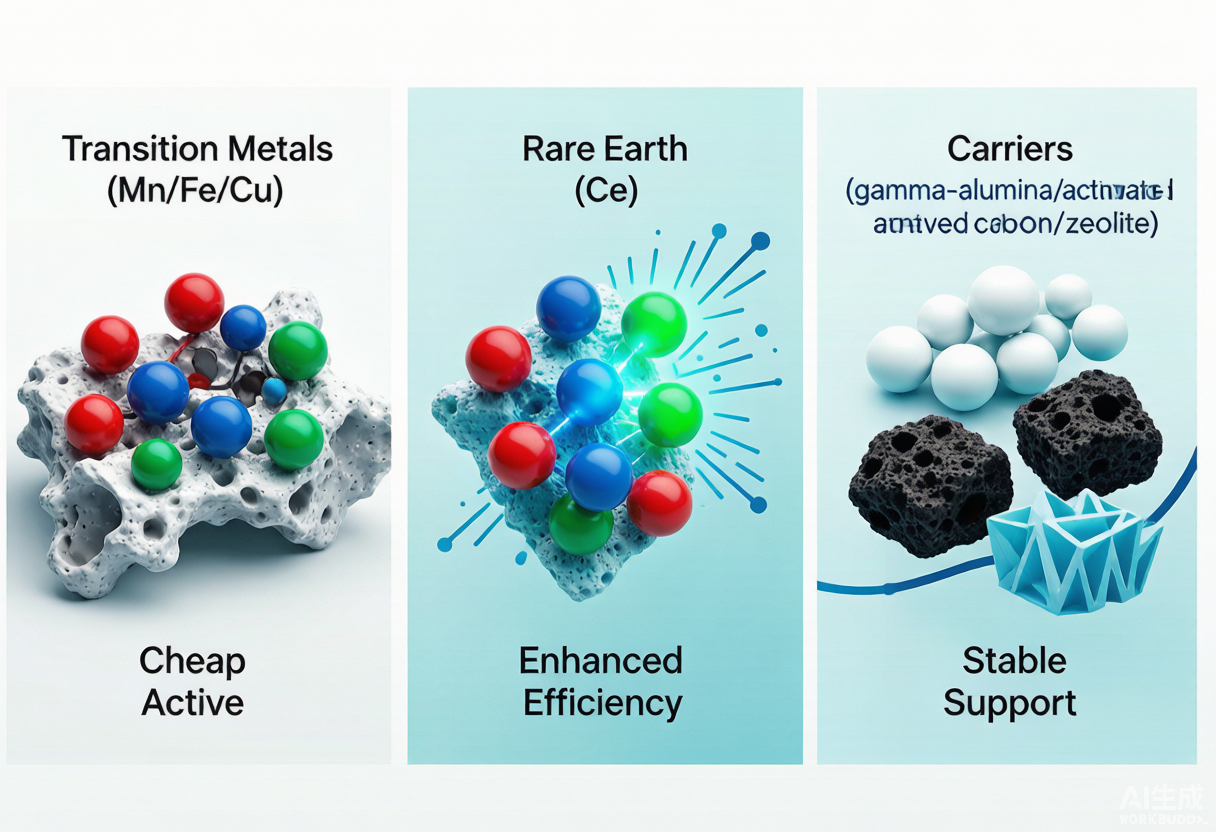
Whether catalytic ozonation can run long term hinges on the catalyst. Active metals fall into three classes:
- Transition metals (Mn, Fe, Cu): variable valence states, good catalytic activity, cheap and readily available — the absolute workhorse in engineering (often Mn, Cu, Ce as the main components). However, transition metals carry a leaching risk and are often compounded with more stable rare-earth or noble metals.
- Rare-earth metals (Ce): highly active and stable, can increase specific surface area and the proportion of surface active oxygen; often used as an activity-boosting secondary component (e.g., Mn-Ce composite).
- Noble metals: the highest activity but expensive and scarce, used in very small amounts.
The support determines mechanical strength and life: γ-Al₂O₃ pellets (acid/alkali-resistant, porous, spherical and resistant to hydraulic shear) are the most common; activated carbon/activated coke (dual catalysis + adsorption) and zeolite (natural, cheap and modifiable) are also widespread.
Two long-run projects attest to stability: ① a coking wastewater project using an Mn-Ce/γ-Al₂O₃ catalyst packed in a reactor 7 m tall and 2.8 m in diameter has run stably for 885 days, with this stage COD removal holding steadily above 45.6% (crystal-facet engineering review, 2022); ② a drinking-water advanced-treatment project using honeycomb ceramic loaded with an Mn-Fe-K composite ran the full HCO+BAC process stably for 699 days. This shows that with proper selection and backwashing, catalytic ozonation can withstand long-term operation.
4. Real Project Accounts (Vendor Measurements and Literature Listed Separately)
| Industry / Conditions | Process and Key Parameters | Performance | Source Type |
|---|---|---|---|
| Coal chemical wastewater advanced treatment | Ozone dose 0.9 kg/m³, reaction 60 min; Shanruo ozone catalyst | Effluent COD 150–200→40–45 mg/L; ozone utilization 88%+; no activity decay after more than 2 years; annual saving about RMB 650,000 | Vendor project case |
| Coking wastewater (biological tailwater) | Mn-Ce/γ-Al₂O₃ catalyst, packed reactor 7 m × Ø2.8 m | This stage COD removal held above 45.6%; 885 days of continuous stable operation | Crystal-facet engineering review (2022, citing the project) |
| Industrial-park secondary effluent | Mn-based catalyst, O₃ 0.84 g/h, catalyst 100 g/L, pH 4.0, 60 min | COD removal 84.8%, TOC 69.3%; after 5 uses the catalyst still held above 80%/55% | University research (comparison of five Mn/Cu/Ce/Fe/La systems) |
| Microbubble ozone–biological coupling | MOR (activated-carbon catalyst, HRT 1 h) + BR (HRT 6 h), O₃/COD = 0.44 | Ozone utilization 94–99%; B/C 0.04→0.30; overall COD removal 66.7%; O₃/COD reduced to 0.68 | Hebei University of Science and Technology pilot (reported by sinokle) |
| Bio-pharmaceutical wastewater | Fe-Mn-Ce/GAC catalyst, 120 min, pH 9, 2 g/L | COD/NH₄⁺-N removal 80.78% / 94.35%; catalyst reused ≥6 cycles | Environmental Engineering, 2019 |
5. Economics: Compared with Fenton — Less Sludge, No pH Adjustment, Faster
- Sludge volume: catalytic ozonation essentially doses no chemicals and cuts sludge production by more than 90% versus Fenton, completely avoiding Fenton massive iron-sludge (hazardous-waste) disposal problem, with no color reversion in the effluent.
- Reaction time: Fenton typically needs ≥60 min; an efficient catalytic ozonation unit can compress this to ≤15 min (vendor CDOF measurement).
- Chemicals and pH: Fenton requires large amounts of acid and alkali to adjust pH to 2–4, while catalytic ozonation mostly runs at neutral or weakly alkaline conditions, saving the acid/alkali adjustment cost.
- Cost range: some vendors report per-tonne treatment cost can be held to RMB 1.5–5/tonne, about 1/3–1/2 of Fenton (on a ≥RMB 25/tonne basis); but costs vary widely with water quality and unit ozone price, and must be verified against local electricity rates and ozone-generator efficiency.
Energy note: the ozone generator is the biggest power draw; high-frequency generators can use as little as about 0.8 kWh/g O₃. One vendor measured total energy of about 1.0 kWh per tonne of water treated (about 25% lower than comparable systems). Choosing the ozone generator affects long-term electricity cost more than choosing the catalyst.
6. Four Pitfalls Engineering Must Watch Closely
1. Catalyst Deactivation Is the No. 1 Enemy
Carbon fouling (organics polymerizing on the surface and covering active sites), metal leaching and poisoning (Ca²⁺/SO₄²⁻ scaling that masks sites) are the three deactivation mechanisms. Countermeasures: regular combined water-air backwashing (e.g., every 7 days), controlling influent suspended solids, and acid/alkali/surfactant regeneration when necessary. Activated-carbon types are limited by available active sites and may decay over the long term, suiting small flows over short periods.
2. Ozone Off-Gas Must Be Destroyed
Unreacted ozone is a strong oxidant and harmful to humans, so an off-gas destructor (catalytic/thermal decomposition) must be installed at the outlet. The higher the utilization, the smaller the off-gas volume and the lower the destructor load — again pointing back to the utilization metric; the two are positively correlated.
3. Temperature and pH Have a Sweet Spot
Balancing solubility and activity, ozone achieves its best solubility and utilization at around 25°C (coking biological tailwater at 25–30°C is near optimal). For pH, alkaline conditions promote ·OH generation, but too high (>10) causes radical self-annihilation; most heterogeneous catalysis runs at neutral or weakly alkaline conditions — before startup, measure the catalyst point of zero charge (pHpzc) and tune pH to near it.
4. Keep the O₃/COD Ratio on Budget
Blindly adding ozone actually raises ozone consumption per unit COD (radical self-annihilation). Engineering experience holds ozone consumed per 1 mg COD removed at 0.25–0.70 mg; beyond that you are burning money and should instead optimize the catalyst, mass transfer (microbubbles) or upstream biological treatment.
7. One-Line Selection Advice
Suitable for: advanced treatment or reuse pre-treatment of tailwater with very low B/C (<0.3) and phenols, heterocyclics, dyes or pharmaceuticals; cases wanting less sludge, no pH adjustment and stable, non-reverting effluent; and where downstream biological treatment can follow (first tear open the refractory compounds to raise B/C, then hand over to microorganisms).
Not suitable for: large-flow scenarios that only seek the lowest initial investment and where the wastewater is already reasonably biodegradable — direct biological treatment or Fenton is usually more economical there; and high Ca²⁺/SO₄²⁻ scaling-prone water, which requires special attention to prevent catalyst blockage, with micro/nano aeration discs needing regular descaling.
8. Combined Processes: Catalytic Ozone Rarely Goes Solo — It Is Usually the Pathbreaker
Catalytic ozone excels at shredding macromolecular, cyclic refractory compounds and raising B/C, but the cost of fully mineralizing COD to CO₂ rises exponentially with depth — mineralizing the last 10% of COD can consume nearly half of the ozone used before it. In engineering it therefore almost never goes solo to the end, but serves as a pathbreaking / pretreatment step: first turning non-biodegradable tailwater into biodegradable water, then handing it to downstream biological treatment to finish cheaply. This is the fundamental source of the ozone–biological coupling economics, and the key reason it can be deployed at scale in standard-upgrade projects.
Three Most Common Pairings
- Catalytic ozonation + BAF (biological aerated filter): after ring-opening raises B/C, the BAF degrades the resulting small-molecule organics with microorganisms nearly for free, at a per-tonne cost far below pure ozone mineralization — the mainstream combination for upgrading industrial-park tailwater.
- Catalytic ozonation + MBR: after raising B/C, a membrane bioreactor follows and the effluent can directly meet reclaimed-water reuse standards; suited to parks that are water-stressed, require reuse, or precede zero liquid discharge.
- Catalytic ozonation + activated carbon (BAC / O₃-BAC): the catalyst and activated carbon combine catalysis + adsorption for a dual effect, particularly effective on tailwater with color, odor or trace toxicants.
Order matters: usually biological treatment first (to consume the readily degradable COD) + catalytic ozonation after (to tackle the refractory fraction). Doing it in reverse — oxidizing the easily degradable fraction with ozone first — is pure waste; the biodegradable part should go to cheap microorganisms, reserving precious ozone for the hard-to-digest fraction.
9. From Pilot to Full-Scale: Do Not Copy Bench-Scale Data Directly
Many projects have attractive bench results but flop once scaled up, usually because three factors were not considered under real operating conditions:
1. Mass-Transfer Scale-Up Effect
Bench tests are mostly batch-mode with full ozone contact; a full-scale plant is continuous-flow with short residence, so actual utilization is determined by gas-liquid contact area and bubble size. Without microbubbles or high-efficiency packing, utilization can easily fall back from 95% to around 70%, directly undercutting economics. At the design stage, mass transfer and catalyst must be treated as core variables alongside — not just — the ozone dose.
2. Real Water-Quality Fluctuation
Pilot tests often use synthetic water, whereas a plant handles mixed real wastewater whose surfactants, emulsified oil and suspended solids (SS) accelerate catalyst deactivation and blockage. As a rule, influent SS should be held below 10 mg/L, with security filtration or coagulation pretreatment added if necessary; high Ca²⁺/SO₄²⁻ scaling-prone water should reserve an acid-wash regeneration connection — do not wait until it is fully blocked.
3. Do Not Run the Ozone Generator at Full Load
Size for peak COD load + 20%–30% margin + future expansion, not against the average. Running flat out at full load both damages equipment and leaves no turndown margin; be sure also to factor in local electricity rates — when power is expensive, the unit cost of ozone soars and a formerly economical process may need to be re-costed. Ozone-generator sizing is often more sensitive to long-term electricity cost than the catalyst itself.
10. Before It Hits the Drawings: An Engineering Checklist and Online-Monitoring Essentials
The principles, metrics, selection and common pitfalls above are laid out, but in a real project success is usually decided by implementation details. A workable engineering checklist is best advanced in three stages:
1. Before Design: Understand the Water Quality Thoroughly
Do not jump straight into a process. First run a full influent analysis: COD/BOD, B/C, SS, pH, Ca²⁺/SO₄²⁻/Cl⁻, and qualitative identification of specific pollutants (GC-MS or LC-MS). Above all, measure B/C — if it is already >0.4, catalytic ozonation is likely unnecessary; if it is <0.3 with phenols or heterocyclics, this is its home turf. Also run bench-scale jar tests on real wastewater (different catalysts + different O₃/COD ratios) to first establish the minimum economical ozone consumption and achievable effluent COD before discussing scale-up.
2. Pilot: Run Continuously on Real Water for 1–2 Weeks
Good bench results ≠ engineering feasibility. Be sure to run a continuous pilot on on-site real wastewater for 1–2 weeks, focusing on three things: whether the catalyst deactivates quickly in real water, whether ozone utilization holds steady, and how fast SS clogs the packing. Nail down the backwash interval and security-filtration precision at the pilot stage to avoid costly shutdowns for unblocking later.
3. Online Monitoring: Watch Three Values
Plant operation runs on data, not intuition: ① online pH/ORP — a fast ORP drop means the radicals are working, and together with pH it shows whether the process is off track; ② off-gas ozone concentration — back-calculates utilization directly, a drop indicating catalyst scaling or ozone-generator decay; ③ rapid effluent COD test (UV/dichromate quick analyzer) — replacing the laboratory lag to give hour-level feedback for adjusting the ozone dose.
References (Verified Sources, Vendor and Literature Listed Separately)
- Li Z, Zuo Y, Xu J, et al. Research progress on ozone catalytic oxidation catalysts for refractory industrial organic wastewater [J]. Industrial Catalysis, 2020, 28(5). (review)
- Han S, et al. Research and perspective of heterogeneous catalytic oxidation by ozone in the removal of pollutants from industrial wastewater: A review. Journal of Environmental Sciences, 2024 (doi:10.1016/j.jes.2024.008281).
- A crystal-facet-engineering perspective on catalytic ozonation (crystal-facet-regulated catalysts for water treatment). 2022 (doi:10.1360/TB-2022-0231). Citing the Mn-Ce/γ-Al₂O₃ coking project at 885 days and honeycomb ceramic Mn-Fe-K at 699 days.
- Peng J, Yang Y, et al. Application of Fe-Mn-Ce/GAC catalyst in advanced treatment of bio-pharmaceutical wastewater [J]. Environmental Engineering, 2019, 37(12):113-119 (doi:10.13205/j.hjgc.201912020).
- Performance study of Mn-based catalytic ozonation for advanced treatment of industrial-park secondary effluent (comparison of five Mn/Cu/Ce/Fe/La systems). University thesis/research.
- Microbubble ozone catalytic oxidation–biological coupling process: advanced treatment of coal chemical wastewater (Hebei University of Science and Technology pilot, ozone utilization 94–99%). sinokle technical report.
- Shanruo Environmental ozone catalyst coal chemical advanced-treatment case (ozone utilization 88%+, annual saving RMB 650,000). Vendor project case (not peer-reviewed; verify when citing).
- Kelier CDOF catalytic ozonation unit technical data (energy ≈1.0 kWh per tonne of water, 90% sludge reduction, reaction ≤15 min). Vendor documentation (not peer-reviewed; verify when citing).