


 Multiple industries nationwide (photovoltaics/semiconductor/panel display/rare e
 Pilot to full-scale engineering (0.5 m³/h to 90,000 m³/d)
Fluoride Removal from Fluoride-Containing Industrial Wastewater: Why Primary Lime Precipitation Always Stalls at 8~10 mg/L
— Calcium Salt Precipitation · Aluminum Salt Coagulation · Adsorption Polishing · Fluidized Bed Crystallization Recovery: Parameter Windows, Real-World Economics, and Technical Boundaries of Cascade Fluoride Removal
I. The Specificity of Fluoride: No "Hydroxide" Fallback
When designing a fluoride-containing wastewater treatment line, the most common mistake is to copy the approach used for heavy metal wastewater—"add alkali, adjust pH, precipitate, press sludge." This route fails outright for fluoride: fluoride does not form sparingly soluble hydroxides under alkaline conditions, and the only available primary precipitation reaction is Ca²⁺ + 2F⁻ → CaF₂(s). And CaF₂ is not "sparingly soluble"—it is merely "not very soluble."
What is more troublesome is the chemical personality of F⁻: small ionic radius, extremely strong electronegativity, a typical hard base with a strong coordination tendency toward hard acids such as Al³⁺, Fe³⁺, Ca²⁺, and Si, readily forming soluble complexes. This is particularly prominent in fluoride-containing wastewater from the electronics industry—some organic compounds contain hydroxyl groups that undergo self-polymerization, and the hydrogen on the hydroxyl group is almost a bare proton, with a stronger attraction to F⁻ than calcium, which will "hold onto" fluoride and hinder the growth of CaF₂. This is precisely the judgment given by an engineering case study of the panel industry published in China Water & Wastewater 2024 年: the effluent fluoride from traditional calcium-based fluoride removal processes generally does not fall below 6.0 mg/L; for projects requiring levels below 1.5 mg/L, simply dosing PAC or calcium chloride makes it difficult to meet the standard.[1]
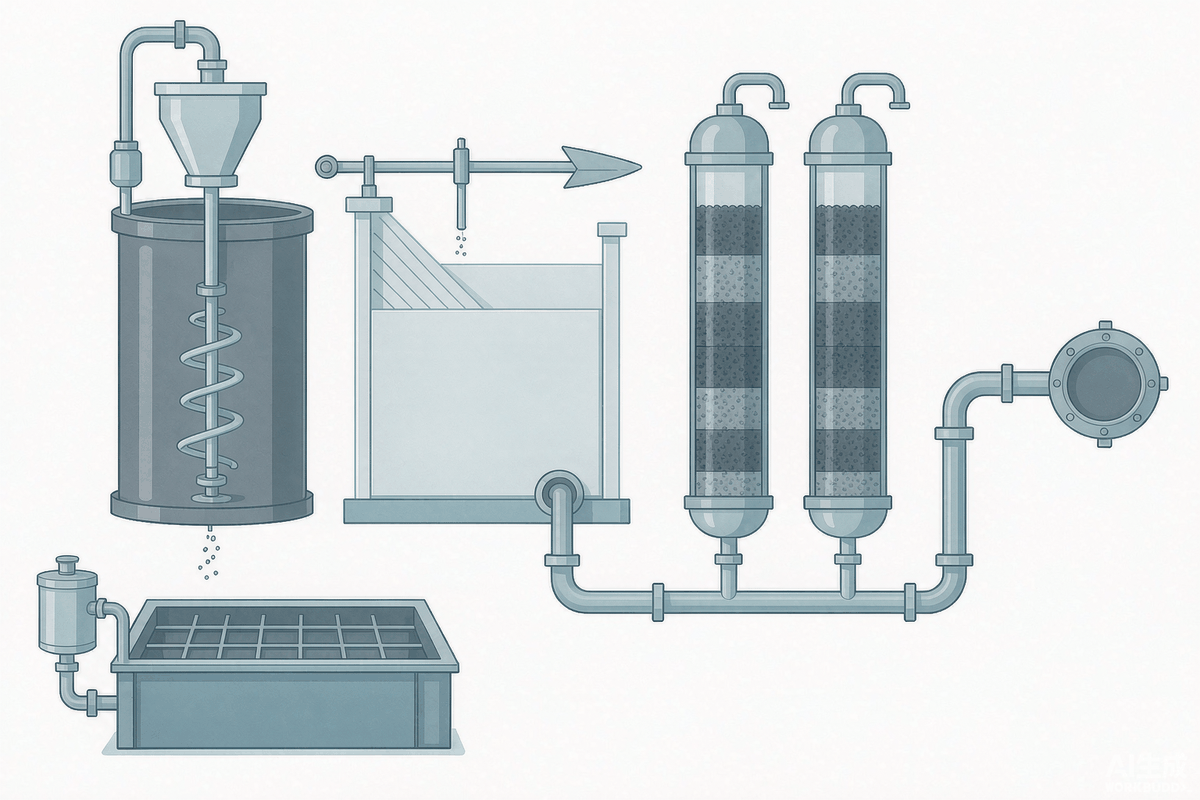
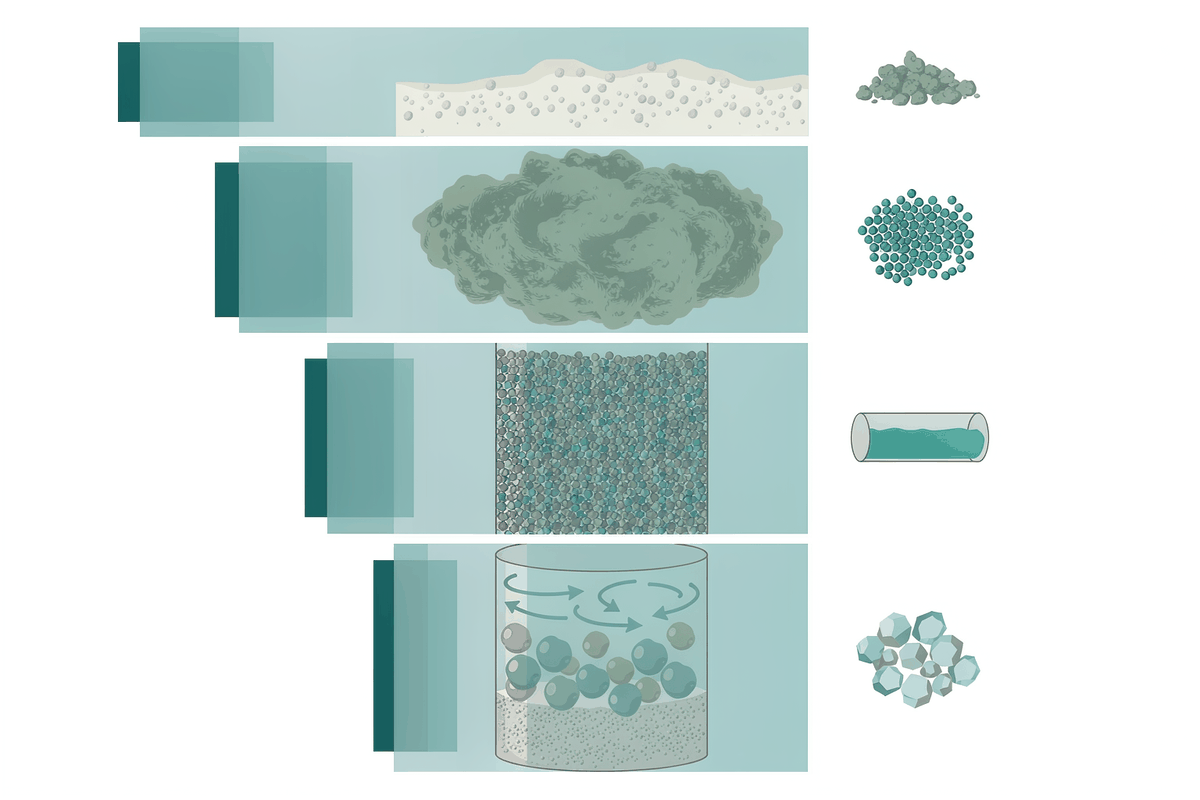
Therefore, the main thread of this article is four words: defense in depth. The first stage, calcium salt precipitation, is responsible for eliminating the fluoride load above 90%; the second stage, aluminum salt coagulation, pushes the concentration down to single digits; the third stage, adsorption polishing, brings it below 1 mg/L; and if the sludge destination must also be addressed simultaneously, the fourth stage, fluidized bed crystallization, converts fluoride into recoverable CaF₂ pellets.
II. Mechanisms: Four Stages and Their Respective Ceilings
2.1 Stage 1 · The Solubility Product Ceiling of CaF₂
Calculated back from pure water at ideal stoichiometry: the fluoride concentration in a saturated CaF₂ solution is 4.28×10⁻⁴ mol/L, equivalent to approximately 8.1 mg/L—this is the source of the industry consensus of "8~10 mg/L." But real wastewater pushes this number upward in three directions:
Competing ions: SO₄²⁻ and PO₄³⁻ compete with Ca²⁺ or form soluble complexes, directly dragging down precipitation efficiency.
pH window: At pH <6, F⁻ converts to HF / HF₂⁻ and remains in the liquid phase; at pH >10, CaF₂ redissolves due to hydroxyl complexation of calcium. The effective window is only the narrow range of pH 7~9; a shift of 0.5 units to one side can double the effluent fluoride within a single retention time. Source: commercial technical literature[13][To be verified]
There is another layer of kinetics that is often overlooked: CaF₂ precipitation consists of two stages — "rapid nucleation at 0~30 min (forming 1~5 μm fine crystals)" and "subsequent slow growth to 50~100 μm via Ostwald ripening" — and the latter stage requires above 10 h for the crystals to fully grow. In engineering practice, lengthening the sedimentation tank HRT is not really buying reaction time, but settling performance. Conversely, poor sedimentation tank effluent is often not due to insufficient dosing, but to crystals that have not grown and are carried out encapsulated by colloids — at this point, continued dosing will only multiply the sludge volume and will not enable the effluent to stably break through 5 mg/L. [13][14][To be verified]
2.2 Second Stage · Aluminum Salt Coagulation: Determining "Whether Single Digits Can Be Achieved"
The mechanism of fluoride removal by coagulation is not simply "adsorption," but a series of three processes: "complexation — co-precipitation — sweep flocculation." Al³⁺ hydrolysis first reacts rapidly with F⁻ to form a series of soluble mononuclear/polynuclear aluminum-fluoride complexes (AlF²⁺, AlF₂⁺, AlF₄⁻, etc.), and the subsequently formed Al(OH)₃ gel encapsulates and co-precipitates these complexes, with the flocs then sweeping and capturing residual F⁻.
The key lies in which aluminum species is actually at work. A comparative study by Wang Xi et al. of the Research Center for Eco-Environmental Sciences (RCEES), Chinese Academy of Sciences, is highly illustrative: using an initial F⁻ concentration of 8.0 mg/L, the highest fluoride removal rates of the highly positively charged polymeric species Al₁₃ ([AlO₄Al₁₂(OH)₂₄(H₂O)₁₂]⁷⁺) at pH 6.0 / 7.0 / 8.0 were 78.2% (dosing 20 mg/L), 71.6% (40 mg/L), and 83.2% (50 mg/L), respectively; under acidic conditions, co-precipitation of highly polymeric aluminum with F⁻ contributed the majority of the removal, whereas monomeric AlCl₃ retained only physical effects under neutral-to-alkaline conditions. [2]This explains why polymeric aluminum chloride is preferentially selected over monomeric aluminum salts in engineering practice.
There is also a counterintuitive conclusion: more complexes does not equal higher removal rate. Research by Qu Jiuhui et al. published in Colloids and Surfaces A found that aluminum-fluoride complexes dominate at low pH and high fluoride concentrations, but the removal rate does not increase accordingly; the fluoride removal efficiency of coagulation in the pH 6.0~9.0 range is higher than that of Al(OH)₃ adsorption under the same conditions, and the mechanism is the formation of new AlFOH co-precipitates. [3]
Research by Deng Ziniu, Zhang Xiaolin, and Pan Bingcai's team at Nanjing University in 2025 年 provided quantitative results: EDTA reduced the fluoride removal efficiency of AlCl₃ by up to 95.4% and that of Al₁₃ by 28.3%; citric acid (CA) was even more severe, reducing them by 100% and 90.6%, respectively. The mechanism is that EDTA-Al-F ternary complexes and Al-CA binary complexes disrupt floc formation; while the bridging fluoride (μ-F) in the Al₁₃ structure enhances thermodynamic stability, tolerating up to 1.50 mmol/L EDTA. [4]
Engineering implication: If cleaning agents, complexing agents, or EDTA-type additives are introduced in the upstream stage, aluminum salt fluoride removal will fail entirely — this cannot be compensated for by increasing the dosage, and wastewater containing chelating agents must be diverted at the source segregation stage.
2.3 Third Stage · Adsorption and Ion Exchange: Pressing 3~5 mg/L Down to Below 1 mg/L
At this stage, the fluoride concentration is already very low, and the thermodynamic space for precipitation is essentially exhausted, so only surface chemistry can be relied upon. The mainstream mechanism is ligand exchange:
M-OH + F⁻ → M-F + OH⁻ (M = Al, Fe, Zr, La, etc.)
There are four representative categories of materials. The first is Activated Alumina (γ-Al₂O₃), where surface hydroxyl groups exchange with F⁻, with the highest efficiency at pH 5.5–6.5, because at this point the surface is highly protonated and the positive charge density is high. The second is Hydroxyapatite (HAP), in which OH⁻ in the crystal lattice is replaced by F⁻: Ca₁₀(PO₄)₆(OH)₂ + 2F⁻ → Ca₁₀(PO₄)₆F₂ + 2OH⁻; China Energy Investment Corporation Langxinming Environmental Protection used "PACl coagulation sedimentation + HAP adsorption" for cascade defluoridation in the 20000 m³/d project in the Inner Mongolia mining area, where the dynamic column at 2 BV/h reached the breakthrough point after adsorbing 54 BV, and regeneration required only 1.5%–2% NaOH.[5] The third is rare earth/zirconium-based materials: La³⁺ reacts with F⁻ to form LaF₃ (Ksp ≈ 7×10⁻¹⁷), which is about six orders of magnitude lower than that of CaF₂; this is the fundamental reason why lanthanum and cerium are generally introduced into "deep defluoridation agents."[11] The fourth is selective resins and nano-adsorbent materials, whose mechanism is likewise surface coordination or selective ion exchange, but with higher specific surface area and stronger resistance to organic interference.
2.4 Fourth Stage (Optional) · Fluidized Bed Crystallization: Turning Sludge into a Product
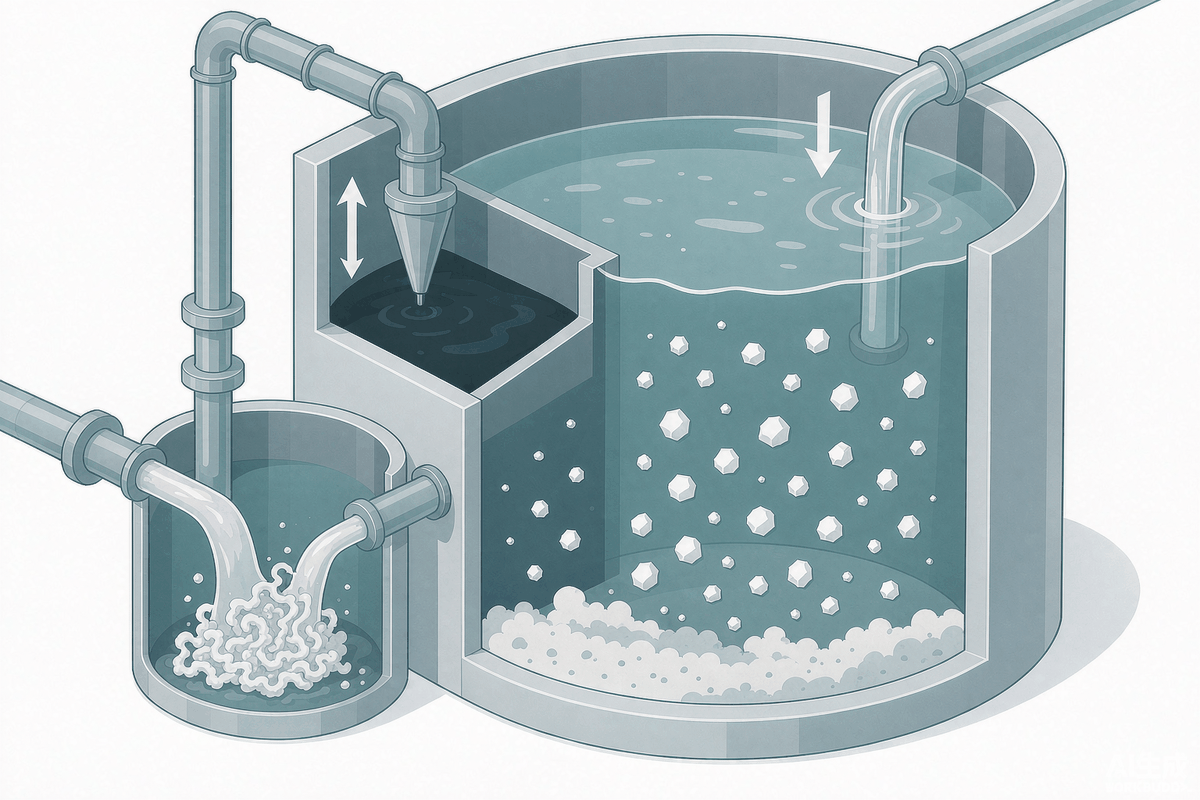
If the only goal is compliance, the first three stages are sufficient; but if the problem of "high moisture content of chemical sludge, difficult stockpiling, and waste of fluorine resources" must also be solved, then a different route is needed—Fluidized Bed Crystallization (FBC): allowing CaF₂ to grow on the surface of silica sand seed crystals and be discharged as millimeter-scale particles, rather than generating gelatinous sludge with a moisture content above 70%. The figures given in the public literature are quite consistent:
· Rare earth smelting wastewater, silica sand seed crystals 30 g: effluent F⁻ ≤8.2 mg/L, defluoridation rate 93.79%, CaF₂ recovery rate 89.45%, particles about 1.5 mm (J. Hazard. Mater. 2019, 373: 313–320)[6]
· Fluoride salt plant wastewater, pilot test 0.5 m³/h: effluent F⁻ <10 mg/L meets the first-level standard, CaF₂ sludge moisture content only 27.0%, average particle size 159.0 μm (Jiang Ke et al., Central South University)[7]
· Electronic manufacturing wastewater, continuous flow: seed crystals 40 g/L, particle size about 0.1 mm, influent 250 mg-F/L → effluent <10 mg/L, defluoridation rate 96.6%, fluorine recovery rate >80%, CaF₂ purity >93%, particles growing from 100 μm to 600 μm (Tsinghua University thesis)[8]
· Semiconductor wastewater simulation, continuous flow FBR: in the first 40 天, defluoridation >90%, crystallization efficiency >95%, CaF₂ purity 91.1%; the two-stage process (HRT 4+1 h, [Ca²⁺]/[F⁻] of 0.55 and 0.7 respectively) reached 94% (Int. J. Mol. Sci. 2024, 25(9): 4646)[9]
III. Parameter Window and Real Accounting
| Stage | Key Parameters | Typical Values / Windows |
|---|---|---|
| Stage 1 Calcium Salt Precipitation | pH, Ca/F molar ratio, reaction and retention time | pH 7~9 (effective window, fails on both sides); Ca/F molar ratio engineering excess 1.5~3.0 (0.6 for crystallization); rapid mixing 30~60 s (G≈500~1000 s⁻¹) + slow mixing 15~30 min; sedimentation HRT recommended ≥10 h to promote crystal aging[12][13][Commercial source, to be verified] |
| Stage 2 Aluminum Salt Coagulation | pH, aluminum species, dosage | pH 6.0~9.0 (Al₁₃ performs best at pH 6 and 8); polyaluminum chloride preferred (higher basicity yields better defluorination); Al₁₃ dosage 20~50 mg/L for F⁻ 8 mg/L; mine water project 35% Al₂O₃ PACl dosage 0.4 g/L[2][5] |
| Coagulation Aid | PAM dosage | 0.1% PAM significantly accelerates floc settling (layering within 10 min of standing), but removal rate does not improve noticeably or even slightly decreases—PAM only accelerates settling, it is not a defluorination agent[5] |
| Stage 3 Adsorption Polishing | pH, filtration rate, breakthrough and regeneration | Activated alumina pH 5.5~6.5; HAP column 2 BV/h, breakthrough 54 BV, 1.5%~2% NaOH regeneration; LaF₃ Ksp≈7×10⁻¹⁷[5][11][Commercial source, to be verified] |
| Stage 4 Fluidized Bed Crystallization | Ca/F ratio, seed crystals, particle size | Ca/F molar ratio 0.6; silica sand seed 30 g or 40 g/L; optimal seed particle size approximately 0.1 mm; recovered particles 0.1~1.5 mm[6][7][8] |
| Project / Industry | Scale | Influent F⁻ | Process and Key Parameters | Performance / Source |
|---|---|---|---|---|
| Panel manufacturing (6th generation AMOLED) fluoride-containing organic wastewater | 9 万 m³/d (industrial 6.5 万) | Designed for high fluoride | Primary/secondary reaction-sedimentation (reaction 15 min + coagulation 15 min + flocculation 15 min, surface loading 3 m³/(m²·h), primary sludge return 30%) + enhanced hydrolysis + modified A/O + MBR + activated carbon + UV | Fluoride controlled at ≤1.5 mg/L, effluent superior to GB 18918 Grade 1A; direct operating cost 3.7~4.7 元/m³ (chemicals account for over 50%); total investment 4.5 亿 yuan[1] |
| Rare earth smelting high-fluoride wastewater | 8000 m³/d (reuse 5500 / discharge 2500) | High fluoride | Chemical precipitation (pH 8.5, Ca/F ratio 0.683) + coagulation-sedimentation (pH 6.7, Al/F ratio 14.62), online fluoride meter for interval-controlled dosing | Effluent F⁻ 0.6~1.0 mg/L, stably meeting 1.5 mg/L target; chemical cost 18.5 元/m³, comprehensive 22.3 元/m³; total project cost 1705.9 万 yuan; chemical precipitation sludge has poor settleability, solved by plate-and-frame filter press[10] |
| Fluoride-containing mine water (Inner Mongolia mining area) | 20000 m³/d | 6~8 (measured 6.72) | Coagulation-sedimentation: 35% Al₂O₃ PACl 0.4 g/L, 200 r/min rapid stirring 1 min → NaOH adjustment to pH 6~7 → 40 r/min slow stirring 15 min → standing 30 min | F⁻ reduced to 0.58 mg/L, removal rate 91.37% (compared with 30PACl 83.48%, 24PACl 80.36%); TDS 793.6→890 mg/L did not exceed irrigation standards[5] |
| Same as above · HAP adsorption polishing | Same as above | Coagulation effluent 4.2 | Hydroxyapatite filter media, 2 BV/h upflow, breakthrough point set at 1 mg/L | Fe-HAP equilibrium adsorption capacity 1.597 mg/g (R²=0.994); pseudo-second-order kinetics + Freundlich multilayer chemisorption (OH⁻/F⁻ exchange); performance well restored after 1.5%~2% NaOH regeneration[5] |
| Rare earth smelting wastewater · Fluidized bed crystallization | Lab-scale | High fluoride | Fluidized bed reactor (FBR), silica sand seed 30 g | Effluent ≤8.2 mg/L, defluorination rate 93.79%, CaF₂ recovery 89.45%, recovered particles approximately 1.5 mm[6] |
| Fluoride salt plant fluoride-containing wastewater · Pilot-scale | 0.5 m³/h | Lab-scale stage 1000 | Fluidized bed crystallization-flocculation combination; Ca/F molar ratio 0.6, CaCl₂/total Ca in calcium solution = 0.10 | Effluent F⁻ <10 mg/L meets Grade 1 of comprehensive wastewater discharge standards; CaF₂ sludge moisture content 27.0%, average particle size 159.0 μm, easy for solid-liquid separation and recovery[7] |
| Electronics manufacturing fluoride-containing wastewater · Continuous flow | Lab-scale / fluidized bed | 250 | CaF₂ seed 40 g/L, seed particle size approximately 0.1 mm, Ca/F molar ratio 0.6 | Effluent <10 mg/L, defluorination efficiency 96.6%, fluoride recovery >80%, recovered CaF₂ purity >93%; particles 100→600 μm; turbidity 1 NTU corresponds to approximately 1.27 mg-F/L[8] |
| Photovoltaic fluoride-containing sludge liquid phase treatment | Experimental | Liquid phase after lime treatment 37 | First add Al₂(SO₄)₃ and stir 15 min (hydrolysis generates [Al₈(OH)₂₀]⁴⁺ as crystal nuclei) → add 10% Ca(OH)₂ to pH 8~9 and stir 1 h 45 min | Defluorination 99.9%, liquid phase F⁻ reduced to 14.9 mg/L; precipitation completed within 10 min (approximately 2 times faster than lime alone); after TCLP testing, converted from hazardous waste CER 100118* to non-hazardous waste CER 100119[15] |
| Photovoltaic cells (8-inch heterojunction) | 15000 m³/d | 180~220 | Two-stage high-efficiency sedimentation tank + nano adsorption tower (primary sedimentation removes approximately 85%) | Effluent 0.7~0.9 mg/L; operating cost per ton of water 1.35 元; footprint 1200 m²[Industry commercial report, to be verified][12] |
IV. Process Comparison: Where Is the Ceiling of Each Stage
| Technology | Limit Effluent F⁻ | Applicable Influent | Key Boundary Conditions | By-products / Cost Basis |
|---|---|---|---|---|
| Calcium Salt Precipitation | 8~10 mg/L | >500 mg/L | pH must be controlled at 7~9; excess calcium salt causes sludge bulking; crystals require over 10 h for maturation | 2~3 kg/m³ high-moisture sludge; chemical dosage per ton of water approx. 0.3~0.5 元[To Be Verified] |
| Aluminum Salt Coagulation | 3~5 mg/L | 100~1000 mg/L | pH sensitive (6.0~9.0); chelating agents/EDTA interference can cause failure; monomeric aluminum salt is less effective than polymeric aluminum | 1~1.5 kg/m³ low-moisture flocs, residual aluminum in water requires attention; approx. 0.8~1.2 元 per ton of water[To Be Verified] |
| Adsorption / Ion Exchange | 0.5~2 mg/L | 5~500 mg/L | Requires periodic regeneration; high Cl⁻, SO₄²⁻ compete for exchange capacity; suspended solids in influent must be removed first | Regeneration waste liquid (high salinity); approx. 0.3~2.5 元 per ton of water, resin route is the most expensive[To Be Verified] |
| Fluidized Bed Crystallization | 8~10 mg/L (+ fluoride recovery) | High concentration (hundreds to thousands of mg/L) | Calcium-to-fluoride molar ratio 0.6; supersaturation and seed crystal particle size must be controlled to avoid homogeneous nucleation and scaling | Produces CaF₂ pellets, moisture content as low as 27%, purity >90%; investment slightly higher than conventional precipitation |
| Reverse Osmosis / Membrane Process | <1 mg/L | 5~200 mg/L | Requires strict pretreatment to prevent scaling; only suitable for relatively low salinity; low water recovery rate | Concentrate accounts for 50%~60% of feed, must be disposed of separately; approx. 0.5~1.2 元 per ton of water[To Be Verified] |
V. Compliance Red Lines and Engineering Truths
In this search, two versions of the fluoride direct discharge limit appeared for GB 30484—2013 "Emission Standard of Pollutants for Battery Industry": three sources state 8 mg/L (indirect 20 mg/L), while another source states 5 mg/L (indirect 15 mg/L); GB 39731—2020 "Discharge Standard of Water Pollutants for Electronic Industry" also has two formulations: "semiconductor/display/photovoltaic device direct 8 mg/L" and "electronic industry direct 10 mg/L". [Discrepancy exists; must be cited after verifying the original standard text] Similarly, the "existing/new" and "general/special emission" limits for fluoride in the aluminum industry are also inconsistent among various secondary sources.
Some commercial materials claim that dosing excess lime (CaO >500 mg/L) can briefly push effluent fluoride down to 3~4 mg/L. This conflicts with the thermodynamic limit of CaF₂: the theoretical residual determined by Ksp=3.9×10⁻¹¹ is about 8 mg/L; in practice, due to co-precipitation, colloidal encapsulation, and kinetic equilibrium, it is difficult in engineering to break through 5 mg/L and maintain it stably. The result of forced chemical dosing is usually a surge in sludge volume by more than 3 times and deterioration of settling performance.[12][Commercial source, pending verification]
Most literature and textbooks take Ksp ≈ 3.9×10⁻¹¹ (corresponding to a theoretical residual fluoride of about 8.1 mg/L), but some fluoride removal agent manufacturers' materials state 3.4×10⁻¹¹ (see also 3.45×10⁻¹¹). The difference affects the expression of the "theoretical limit," but from an engineering conclusion perspective, both point to the 8~10 mg/L order of magnitude, and do not affect selection judgment.
① The role of primary precipitation is to "reduce load," not to "ensure compliance." Setting the primary stage goal at removing more than 90% of the fluoride load and ensuring sludge can be dewatered is more economical than pursuing low effluent concentration.
② Chemical cost is the main cost component of fluoride-containing wastewater. In panel industry examples, direct operating cost is 3.7~4.7 元/m³, with chemicals accounting for more than 50%; in a rare earth high-fluoride wastewater case, chemical cost per ton of water is 18.5 元. The room for cost reduction lies in precise dosing control and segregated collection, not in reducing structures.
③ The side effects of salt addition must be calculated in advance. Aluminum salt dosing will simultaneously raise TDS (in a mine water case from 793.6 to 890 mg/L) and residual aluminum; sodium-based alkali liquor for pH adjustment will introduce sodium ions. Reuse scenarios and total salt control scenarios must incorporate these two items into the design.
④ Segregated collection is more valuable than end-of-pipe chemical dosing. If wastewater containing chelating agents/complexing agents and wastewater containing high concentrations of PO₄³⁻ are not separated out, they will respectively break through the two stages of aluminum salt coagulation and calcium salt precipitation—this is the real reason many projects experience "more and more chemicals dosed, yet water quality becomes less and less compliant."
⑤ If resource recovery is desired, do not continue on the old path of "lime + iron salt + large amounts of sludge." Public data on fluidized bed crystallization (fluoride removal rate 93%~97%, CaF₂ purity >90%, moisture content 27%) is already sufficient to support engineering judgment; however, it has a preference for influent fluoride concentration—Tsinghua research clearly points out that the lower the influent concentration, the higher the recovery rate, and the higher the concentration, the higher the fluoride removal efficiency; around 250 mg-F/L is the balance point.
VI. References
- Li Juan, Yang Dawei. Engineering Case of Advanced Treatment of Fluoride-Containing Industrial Wastewater with High Effluent Standards[J]. China Water & Wastewater, 2024, 40(2): 126-130. (Sichuan Mianyang panel industry 9 万 m³/d fluoride-containing organic wastewater project: primary/secondary reaction sedimentation + enhanced hydrolysis + modified AO + MBR + Activated Carbon + UV; fluoride ≤1.5 mg/L)
- Wang X, Xu H, Wang D. Mechanism of fluoride removal by AlCl₃ and Al₁₃: The role of aluminum speciation[J]. Journal of Hazardous Materials, 2020, 398: 122987. DOI: 10.1016/j.jhazmat.2020.122987.
- Gong W X, Qu J H, Liu R P, Lan H C. Effect of aluminum fluoride complexation on fluoride removal by coagulation[J]. Colloids and Surfaces A, 2012, 395: 88-93. DOI: 10.1016/j.colsurfa.2011.12.010.
- Deng Z, Xu A, Zhang X, Zhang K, Pan B. Effects of Chelators on Fluoride Removal by AlCl₃ and Al₁₃ Coagulation: Performance and Mechanism[J]. 2025. MEDLINE ID: 39918795. (Nanjing University)
- Zhao Yan, Lu Mengnan, Sun Bin, Li Jingfeng, Xu Zhiqing, Teng Dongyu. Industrial Application Study on Combined Coagulation-Adsorption Defluoridation Technology for Fluoride-Containing Mine Water[J]. Coal Science and Technology, 2020, 48(9). (CHN Energy Beijing Langxinming Environmental Protection Technology Co., Ltd.; 20000 m³/d; 35% Al₂O₃ PACl removal rate 91.37%; hydroxyapatite adsorption breakthrough 54 BV)
- Zeng G, Ling B, Li Z, Luo S, Sui X, Guan Q. Fluorine removal and calcium fluoride recovery from rare-earth smelting wastewater using fluidized bed crystallization process[J]. Journal of Hazardous Materials, 2019, 373: 313-320. DOI: 10.1016/j.jhazmat.2019.03.050.
- Jiang Ke, Zhou Kanggen, Yang Youcai, Li Chengwen. Bench-scale and Pilot-scale Study on Treatment of Industrial Fluoride-Containing Wastewater by Fluidized Bed Crystallization[J]. (School of Metallurgical Science and Engineering, Central South University; bench-scale 15 L/h, pilot-scale 0.5 m³/h)
- Tsinghua University Dissertation. Crystallization Enhancement and Resource Utilization of Fluoride in Electronic Wastewater. (Fluidized bed induced crystallization; seed 40 g/L, calcium-to-fluoride molar ratio 0.6, defluoridation efficiency 96.6%, fluorine recovery >80%, CaF₂ purity >93%)
- Sinharoy A, Lee G Y, Chung C M. Process Intensification for Enhanced Fluoride Removal and Recovery as Calcium Fluoride Using a Fluidized Bed Reactor[J]. International Journal of Molecular Sciences, 2024, 25(9): 4646. DOI: 10.3390/ijms25094646.
- Technical Strategy Research and Engineering Case of Ultra-Low Emission for High-Fluoride Rare Earth Wastewater[J]. Chinese Journal of Environmental Engineering, 2024. DOI: 10.13205/j.hjgc.202410002. (8000 m³/d; pH 8.5, calcium-to-fluoride ratio 0.683; coagulation pH 6.7, aluminum-to-fluoride ratio 14.62; effluent 0.6~1.0 mg/L)
- Review of Defluoridation Agent Mechanisms and Adsorption Materials (Activated Alumina, Hydroxyapatite, Rare Earth/Zirconium-Based Materials, Membrane Processes, Ion Exchange)[EB/OL]. Industry Technical Materials. (Commercial source; mechanism descriptions are consistent with peer-reviewed literature; specific values are recommended for secondary verification)
- Process Selection and Cost Comparison for Fluoride Below 1 mg/L[EB/OL]. Industry Technical Materials, 2024. (Commercial source: comparison of limit effluent quality, investment intensity, per-ton water operating cost and footprint for four types of technologies; photovoltaic 15000 m³/d case)[Values Pending Verification]
- Fluoride Discharge Standard: Global Limits & Treatment Guide[EB/OL]. Industry Technical Materials, 2026. (Commercial source: estimation table of the effect of ionic strength/temperature on residual fluoride in CaF₂, pH window)[Values Pending Verification]
- Process Parameter Design and Engineering Practice of Two-Stage Chemical Precipitation for Hydrofluoric Acid Wastewater[EB/OL]. Industry Technical Materials. (Commercial source: CaF₂ nucleation-ripening kinetics, crystal particle size distribution, two-stage precipitation molar ratio)[Values Pending Verification]
- An Effective New Treatment of Fluoride-Containing Sludge Resulting from the Manufacture of Photovoltaic Cells[J]. Processes, 2021, 9(10): 1745. DOI: 10.3390/pr9101745.
- Ministry of Ecology and Environment. Reply Letter on Proposal No. 03132 (Resource and Environment Category No. 194) of the Third Session of the 14th National Committee of the Chinese People's Political Consultative Conference[EB/OL]. 2025-11-20. (17 industry water pollutant discharge standards all impose control requirements on fluoride; local industry-specific direct discharge limits are generally 5~10 mg/L; watershed-type limits are mostly controlled within 5 mg/L; Tianjin Comprehensive Wastewater Discharge Standard direct discharge limit 1.5 mg/L)